Bookmarklet to Manually Set document.referrer

At Help Scout today I’m working on a tracking script to help us track where our visitors are coming from. One of the ways it identifies that is using document.referrer which returns the referring URL.

For example, if you go to Google, click on a link, then check out the value of document.referrer in the JavaScript console, it will tell you it was google.com:

> document.referrer
"https://www.google.com/"

For testing the script I’m working on I needed a way to manually set the value of the referrer to quickly test that the script is handling it correctly.

Unfortunately you can’t directly overwrite the value:

> document.referrer = "test.com"
"test.com"
> document.referrer
"https://www.google.com/"

Good news is that there’s a hacky way you can do it by overwriting what document.referrer returns. After modifying the code slightly (setting configurable: true), I was able to turn it into a bookmarklet that prompts you for what you want to set the referrer to:


javascript:(function(){
var newReferrer = prompt('Set the referrer:');
Object.defineProperty(document, "referrer", {configurable: true, get : function(){ return newReferrer; }})
})();

Then when you click this bookmarklet, you can set the new referrer value:

Screen Shot 2018-01-25 at 11.55.06 AM.png

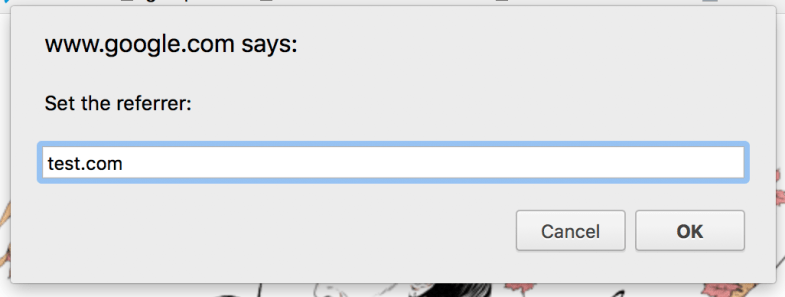
And document.referrer will return the new value:

> document.referrer
"test.com"

Help Scout’s New Partnership with Fivetran

Today at Help Scout we’re excited to announce that we’re partnering with Fivetran, a fantastic service that makes it easy to centralize all of your data in a data warehouse. You can read my blog post about the partnership here: Performing Advanced Analytics on Your Help Scout Data with Fivetran.

The short version is that if you’re a Help Scout customer, you can sign up for Fivetran (for free!) and use it to get all of your mailbox data out of Help Scout and into a data warehouse like BigQuery. From there you can use SQL to analyze the data (on its own or combining it with your data from other services) or hook it up to a Business Intelligence tool for easy analysis and charting.

If this sounds interesting to you, check out the blog post and don’t hesitate to reach out if you have any questions about any of it: matt@helpscout.com.

Quantity and Quality Metrics

Something I learned from Help Scout’s former Growth Lead, Suneet Bhatt, is that for every quantity metric you should also strive to have an associated quality metric.

For example, one of the metrics we look at is the number of New Customers. We also track Initial Average New Users Per Customer. Together these help us understand not just how many new customers we’re bringing in, but how large they are.

  • Quantity Metric: New Customers
  • Quality Metric: Initial Average New Users Per Customer

New Trials is a quantity metric. A quality metric for it might be the % of trials that convert into customers. I’ve found with my own products that that it’s easy to have either the quantity or quality metric go up, but hard to have both. For example, with Preceden, my timeline maker tool, New Trials tends to plummet during the summer months when students are not in school (a lot of students use Preceden to create timelines for class projects). When this happens, the trial to paid conversion rate goes way up because without a large number of students signing up (who rarely convert into paying customers), the conversion rate for the remaining trials winds up being pretty good. Then in the Fall when school resumes, trials increase as students begin signing up again, but trial to paid conversion rates fall. If I could find a way to increase conversion rates as more students sign up, it would be huge – but way easier said than done.

  • Quantity Metric: New Trials
  • Quality Metric: Trial to Paid Conversion Rate

Another example from Help Scout: we track how many new employees we hire, but also measure what % leave within 1 year. If our hiring process works well, the % that leave within a year should be fairly low; if not, it will be high.

  • Quanity Metric: New Employees
  • Quality Metric: 1-Year New Employee Churn Rate

When you’re thinking about your own business’s metrics, try to come up with quality metrics for most quantity metrics. You’ll gain a deeper understanding of the health of the business which allows you to make better decisions about its future.


Identifying the Primary Keys for Deleted MySQL Records

At Help Scout today I had to perform an analysis that required me to identify the primary keys of deleted MySQL records.

For example, these results contain primary keys for records 1-5 but not 6-10:


SELECT mpy_id FROM members_payments WHERE mpy_id BETWEEN 1 AND 10;
+——+
| mpy_id |
+——+
| 1 |
| 4 |
| 6 |
| 9 |
| 10 |
+——+

The question is how to identify records 2, 3, 5, 7, and 8.

With the help of Stack Overflow, I found a neat solution that involves creating a temporary table of all possible primary keys, then left joining it on the original table to identify the missing ones. Here’s what it looks like, customized for my situation:


SET @mpy_id = (SELECT MAX(mpy_id) + 1 from members_payments);
DROP TABLE IF EXISTS members_payments_all_ids;
CREATE TEMPORARY TABLE members_payments_all_ids AS (
SELECT @mpy_id := @mpy_id 1 AS mpy_id
FROM members_payments mp1, members_payments mp2
WHERE @mpy_id > 1
);
SELECT members_payments_all_ids.mpy_id
FROM members_payments_all_ids
LEFT JOIN members_payments ON members_payments_all_ids.mpy_id = members_payments.mpy_id
WHERE members_payments.mpy_id IS NULL
ORDER BY members_payments_all_ids.mpy_id ASC
+——+
| mpy_id |
+——+
| 2 |
| 3 |
| 5 |
| 7 |
| 8 |
| … |
+——+

view raw

solution.sql

hosted with ❤ by GitHub

This solution does require that the keys be auto-incrementing, but that should be the case most of the time. Also, it assumes the last record is not deleted.

Happy querying!