Building a Looker-Powered Daily Metrics Email Report

One of the main ways we evangelize metrics at Help Scout is with a daily metrics report that is automatically emailed to the entire company every morning.

In the email we highlight the performance of our key business metrics (New Trials, New Customers, etc) for the day prior and for the month to date. We also include our projection and target for the month to help us understand how we’re doing for the month.

Here’s what it looks like (with a shortened list of metrics and no actual numbers):

Screen Shot 2018-06-26 at 10.50.17 AM.png

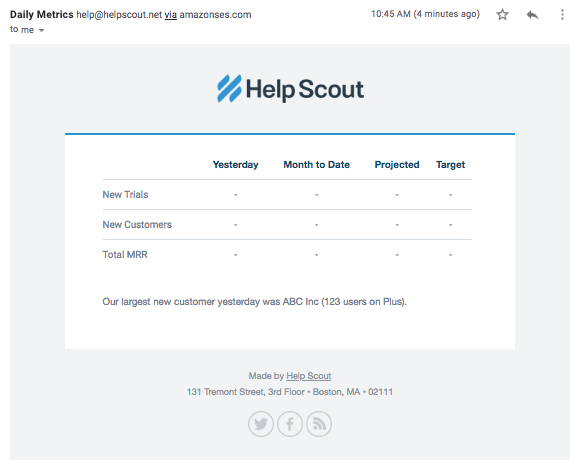
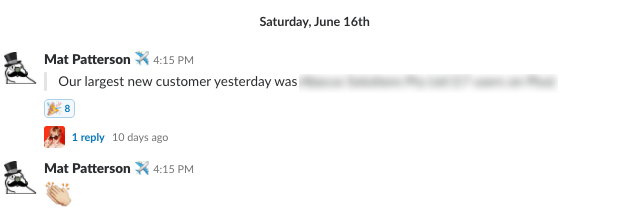
Because the report is delivered over email and doesn’t require logging into a separate tool, it makes it easy for everyone to keep up to date about how the business is doing. It’s also a frequent cause for celebration in Slack:

daily-metrics-yay.png

In years past a prior version of this report was generated with a lot of PHP code that was responsible for calculating all of the metrics and delivering the email.

When we adopted Looker as our Business Intelligence tool last year we ran into a problem though because we had refined how a lot of our metrics were calculated as we implemented them in Looker. As a result, Looker would sometimes report different values than daily metrics report. This obviously wasn’t ideal because it caused people to mistrust the numbers: if Looker said we made $1,234 yesterday but the metrics email said we made $1,185, which was correct?

Our solution was to rebuild the daily metrics email to use Looker as the single source of truth for our metrics. Rather than calculate the metrics one way in Looker and painstakingly try to keep the PHP logic in sync, we rebuilt the metrics email from scratch in Ruby and used Looker’s API to pull in the values for each of the metrics. This ensured that the numbers in Looker and the daily metrics email always matched since the daily metrics email was actually using the metrics calculated by Looker.

Building a Daily Metrics Report for your business

If you use Looker and want to build something similar for your organization (which I highly recommend!), I open sourced a super-simple version of ours to help you get started:

https://github.com/mattm/looker-daily-metrics-email

For this demo, it assumes you have a Look with a single value representing the number of new customers your business had yesterday:

Screen Shot 2018-06-26 at 10.46.43 AM.png

When you run the script, it will query Looker for this value, throw it into a basic HTML-formatted email, and deliver it:

Screen Shot 2018-06-26 at 10.48.33 AM.png

You will of course want to customize this for your business, make the code more robust, style the email, etc – but this should save you some time getting it off the ground.

If you run into any issues feel free to reach out. Good luck!

Edit: Here’s a recording of a talk from JOIN 2018 I gave on this topic.

A Frequent Communication Mistake I’ve Made as a Data Analyst

Looking back at my time so far as a data analyst, some of the biggest mistakes I’ve made were not technical in nature but around how I communicated within the organization.

Two real-world examples to illustrate:

A few years ago at Automattic our ad revenue was way down from what our marketing team expected it to be. For example (and I’m making up numbers here), for every $100 we were spending on ads, we had been making $150 historically, but in recent months we were making $25. Either the performance had gone way down or there was some issue with the tracking and reporting.

I was on the data team at the time and volunteered to work with the marketing team to investigate. As it turned out, there was indeed an issue: there was a problem with the way AdWords was appending UTM parameters to our URLs which was breaking our tracking. For example, a visitor would click an ad and land on wordpress.com/business&utm_source=adwords – note that there’s an amperstand after the URL path instead of a question mark, so the correct UTM source wouldn’t get tracked and the customer wouldn’t get attributed to AdWords.

Fortunately, we had some event tracking set up on these pages (Tracks for the win) that recorded the full URL, so I was able to go back and determine which customers came from ads and calculate what our actual return on ad spend was. After figuring out the issue and determining how much unattributed revenue we had, I wrote up a lengthy post about what happened and published it on our internal marketing blog without informing the marketing team about it first.

Second example: a few months ago at Help Scout, we had an ambitious revenue target for Q1. With a few days left in the quarter, we were still projecting to come in short of the target and no one realistically expected us to reach it. Something about the projection seemed off to me so I dove in and realized there was a mistake in one of the calculations (it was my fault – in the projection we weren’t counting revenue that we earned that month from customers that were delinquent who then became paying again). As a result, our projection was too low and we likely were going to hit our target (and eventually did!). I wrote up a lengthy message about what happened and published it in one of our company Slack channels without informing any of the leadership about it first.

To understand the problem, it’s important to note that as a data analyst, I haven’t typically been responsible for the performance of our metrics. I help set up tracking and reporting and help ensure accuracy, but someone else in the organization is responsible for how well those metrics were doing.

In both of the cases above, I wasn’t intentionally bypassing people. At the time, it was more like “oh, hey, there’s a bug, now it’s fixed, better let everyone know about it” – and probably an element of wanting credit for figuring out the issue too.

However, not consulting with those responsible for the metrics before reporting it was a mistake for several reasons:

  • They didn’t have an opportunity to help me improve how the issue and impact were communicated with the rest of the company and its leadership.
  • I missed an opportunity to have them doublecheck the revised calculations, which could have been wrong.
  • Even though we were doing better than we had been reporting in both cases, it may have indirectly made people look bad because they had been reporting performance based on inaccurate data. They should not be finding out about the issue at the same time as the rest of the company.

In neither case was there any big drama about how I went about it, but it was a mistake on my part nonetheless.

Here’s what I’d recommend for anyone in a similar role: if someone else in your organization is responsible for the performance of a metric and you as a data analyst discover some issue with the accuracy of that metric, always discuss it with them first and collaborate with them on how it is communicated to the rest of the company.

It sounds obvious in retrospect, but it’s bitten me a few times so I wanted to share it with the hope that it helps other analysts out there avoid similar issues. Soft skills like this are incredibly important and worth developing in parallel with your technical skills.

If you’ve made any similar mistakes or have any related lessons learned, I’d love to hear about them in the comments or by email. Cheers!

A Simple MRR Spreadsheet Model

Screen Shot 2018-06-15 at 2.21.51 PM.png

A buddy of mine asked for help creating a simple spreadsheet to model his startup’s Monthly Recurring Revenue (MRR) over time given various assumptions. He suggested I share it so others can check it out as well.

You can find the Google Sheet here: Simple MRR Spreadsheet Model. It lets you tinker with a few variables to estimate what your MRR will look like over the next two years. You’ll want to make a copy (File > Make a copy…) to edit it.

The variables include:

  • Monthly visitors
  • Monthly visitor growth %
  • Visitor to trial %
  • Trial to paid %
  • Average monthly revenue per customer
  • Monthly churn %

A big asterisk is that this is a very, very simple model and how your MRR actually plays out will depend on a lot of things like how long your trial period is, how your churn rate differs for new customers vs long-time ones, conversion rates and churn rates by plan, how your conversion rates changes as the quality of your traffic changes, and a lot more. That said, this should get you in the right ballpark.

One important thing to note for anyone getting into recurring revenue is the impact your growth rate and churn rate have on your bottom line. For example, if you’re not growing, churn will eventually cause your MRR to plateau.

For example, here’s a model with 0% monthly growth:

Screen Shot 2018-06-15 at 2.24.58 PM.png

And here’s the exact same model with 10% monthly growth:

Screen Shot 2018-06-15 at 2.26.56 PM.png

You can play around with it to get an idea of how different numbers impact your long term growth.

If you have any suggestions for improving it just drop a comment below or shoot me an email – thanks!

Wrangling dbt Database Permissions

One of the more time consuming aspects of getting dbt working for me has been figuring out how to set the correct database permissions. I’m comfortable analyzing data once it’s in a data warehouse, but haven’t have a ton of experience actually setting one up. This post is for anyone else in a similar spot looking to set up dbt.

For some context going into this, I’m using Amazon RDS for Postgres with Heroku data made available by Stitch.

Big picture, to summarize Martin Melin who gave me some tips on this on dbt Slack, is for each person to have a user with full access to its own dedicated schema and read-only access to the source schemas.

For a quick key on the different roles in my setup:

  • mhmazur: The superuser
  • mazur: The dbt user
  • stitch: For Stitch to use
  • mode: For Mode to use

1) Create a user for dbt to use to connect to your data warehouse

With the exception of step 4, all of these need to be run from a superuser account:

-- As mhmazur
create role mazur with login password '...';

These are the credentials you’ll set in your profile.yml file for dbt to use to connect to your data warehouse.

2) Create an analytics schema

-- As mhmazur
create schema analytics;

This is where the production views and tables that dbt creates will exist. Your BI tools and analyses will use this data.

You could also set one up for development (and adjust the commands below accordingly) by changing the schema name to something like “dbt_mazur”.

If you tried to run dbt at this point, you’d get an error like “permission denied for schema analytics” because the dbt user doesn’t have access to it yet.

3) Give the dbt user full access to the analytics schema

-- As mhmazur
grant all on schema analytics to mazur;

Almost there! If you tried to run dbt now, you would get a different error: “permission denied for schema preceden_heroku” because the user doesn’t have access to the sources tables yet.

4) Make the dbt user the owner of the schema

-- As mhmazur
alter schema analytics owner to mazur;

This is necessary because when you created the schema, your superuser role became its owner. We need our dbt user to be the owner so that it can grant usage permissions from dbt hooks (see down below).

5) Finally, give the dbt user read-only access to the source tables

In order to transform the data, dbt needs to be able to query the source tables. In my case, the source tables live in a “preceden_heroku” schema owned by a “stitch” user. Therefore, to grant read-only access to the dbt user, I have to log in as the “stitch” user and run the following:

-- As stitch
grant usage on schema preceden_heroku to mazur;
grant select on all tables in schema preceden_heroku to mazur;

The last command is necessary even if you don’t materialize any models as tables because it also grants select permissions on views as well (even though it just says “tables” in the command). Per the docs: “note that ALL TABLES is considered to include views”.

Undoing these changes

You may run into issues and need to reverse these changes. Here’s how:

From the “stitch” user, revoke the read-only rights you gave to the user:

-- As stitch
revoke usage on schema preceden_heroku from mazur;
revoke all privileges on all tables in schema preceden_heroku from mazur;

Then from the dbt user (“mazur” in my case) change the owner back to your superuser:

-- As mazur
alter schema analytics owner to mhmazur;

Then back from your super user account (“mhmazur” for me), revoke permissions to the analytics schema:

-- As mhmazur
revoke all on schema analytics from mazur;

And then remove the analytics schema:

-- As mhmazur
drop schema analytics cascade;

And finally remove the user:

-- As mhmazur 
drop role mazur;

Granting read-only access to the analytics schema

One last thing: you’ll want to grant read-only access to the analytics schema so that your BI tool can execute queries. As the dbt user, run:

-- As mazur
grant usage on schema analytics to mode;
grant select on all tables in schema analytics to mode;

You’ll want to set this up as a hook so that whenever dbt changes the views and tables your BI maintains the correct permissions:

on-run-end:
 - 'grant usage on schema "{{ target.schema }}" to mode'
 - 'grant select on all tables in schema "{{ target.schema }}" to mode'

If you don’t do this, you’ll wind up getting a “permission denied for schema ______” or “permission denied for relation ______” error in your BI tool.

Happy querying!