Next week I’m excited to be speaking at JOIN, Looker’s annual user conference in San Francisco.
My talk (at 11:15am on Wednesday the 10th) is about how we use Fivetran, Looker, and email to get more people at Help Scout interested in and engaged with our metrics, a topic which I’ve written about previously on this blog. Huge thanks to Fivetran for sponsoring this session.
I’ll also be at the dbt meetup on Tuesday the 9th.
If you happen to be attending either the meetup or the conference, drop me a note – I’d love to say hey 👋.
For one of my recent consulting projects, I worked with a client to automate their Facebook Ad Insights reporting in Looker. There are some nuances with the data that made it a little tricky to figure out initially, but in the end we wound up with a pretty elegant model that is going to let them report on all of their key metrics directly from Looker. This post is about how you can do the same.
If you’d like to get notified when I release future tutorials like this, make sure to sign up for my Matt on Analytics newsletter.
The Objective
By the end of this tutorial, you’ll be able to analyze your Facebook Ad Insights data in Looker using the following 15 fields: Account ID, Account Name, Ad ID, Adset ID, Campaign ID, Campaign Name, Country, Report Date, CPM, CTR, ROAS, Total Conversion Value, Total Impressions, Total Link Clicks, and Total Spend.
Setting up the Connection in Fivetran
Fivetran makes it incredibly easy to centralize all of your data in a data warehouse for analysis in a BI tool like Looker. This tutorial assumes you’re using Fivetran, but if you’re using another ETL tool like Stitch to grab your Ad Insights data, the modeling should be fairly similar.
There are a lot of ways to slice and dice your Facebook data, but for the key metrics mentioned above, here’s what your setup should look like:
Breakdown should be country – this means all of the reporting data will be segmented by country. You could segment it in additional ways like by age, gender, etc depending on your needs – just make sure to adjust the model accordingly if you do.
Action Breakdowns should be action_type.
Fields should be account_name,action_values, actions,campaign_id, campaign_name, impressions, inline_link_clicks, and spend.
Click Attribution Window for us is 28 days and View Attribution Window is 1 day.
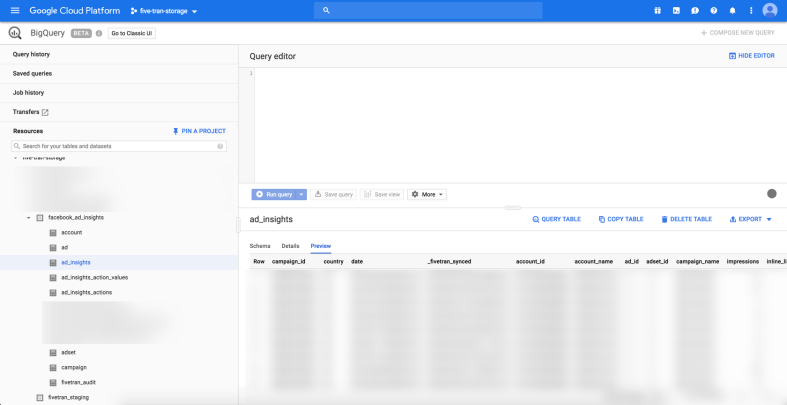
Once connected, Fivetran will pull all of the relevant data from Facebook using the Facebook Ad Insights API and throw into your data warehouse:
There are two key tables:
ad_insights – This table has data related to the spend: campaign_id, country, date, account_id, account_name, ad_id, adset_id, campaign_name, impressions, inline_link_clicks, and spend.
ad_insights_action_values – This table has data related to how much revenue was earned as a result of that spend: campaign_id, country, date, _1_d_view, _28_d_view, action_type, and value.
For example, to see spend metrics by campaign for a given day, we can run a query like this:
This file contains hidden or bidirectional Unicode text that may be interpreted or compiled differently than what appears below. To review, open the file in an editor that reveals hidden Unicode characters. Learn more about bidirectional Unicode characters
And to see conversions by campaign on a given date:
This file contains hidden or bidirectional Unicode text that may be interpreted or compiled differently than what appears below. To review, open the file in an editor that reveals hidden Unicode characters. Learn more about bidirectional Unicode characters
One key note about the conversion data that will come into play later: there may be several different values for action_type, but the only one that matters for measuring total conversion value is offsite_conversion.fb_pixel_purchase; everything else can be ignored.
Another important point: conversion data is cohorted by the day of the spend, not the day the conversion happened. That matters because it means there will never be conversions on days without spend. Put another way: every row in the conversion data has a corresponding row in the spend data. As we’ll see, that means we can join the spend data to the conversion data and we’ll capture everything we need.
Modeling the Data in Looker
Identifying the primary keys
Spend data in the ad_insights table can be uniquely identified by the combination of the date, campaign id, andcountry. We can set up a primary key dimension like so:
This file contains hidden or bidirectional Unicode text that may be interpreted or compiled differently than what appears below. To review, open the file in an editor that reveals hidden Unicode characters. Learn more about bidirectional Unicode characters
For the conversion data, this comes close, but there can also be many action_type records for each date/campaign/country combination so we can’t just use that as the primary key.
That said, because we only care about action_type of offsite_conversion.fb_pixel_purchase, it simplifies the modeling to create a derived table that consists of only actions of this type, that way we can use date/campaign/country as the primary key.
You can model this in dbt or simply create a derived table in Looker by filtering fb_ad_insights_action_values accordingly (we’ll wind up calling this fb_conversions below).
select *
from fivetran.fb_ad_insights_action_values
where action_type = "offsite_conversion.fb_pixel_purchase"
By only working with this derived table, there will be a one-to-one relationship between the spend data and the conversion data.
Creating the Model
Here’s what the model winds up looking like:
This file contains hidden or bidirectional Unicode text that may be interpreted or compiled differently than what appears below. To review, open the file in an editor that reveals hidden Unicode characters. Learn more about bidirectional Unicode characters
We’re left joining the spend data to the derived conversion table and because the conversion data is already filtered to only include the fb_pixel_purchase action_type, there’s a one-to-one relationship.
Creating the Spend View
Here’s what it looks like:
This file contains hidden or bidirectional Unicode text that may be interpreted or compiled differently than what appears below. To review, open the file in an editor that reveals hidden Unicode characters. Learn more about bidirectional Unicode characters
This file contains hidden or bidirectional Unicode text that may be interpreted or compiled differently than what appears below. To review, open the file in an editor that reveals hidden Unicode characters. Learn more about bidirectional Unicode characters
At the top you’ll see that this is a derived table from the original fb_ad_insights_action_values provided by Fivetran.
The only noteworthy metric here is the ROAS measure which takes the total conversion value measure and divides it by the total spend measure from the spend view.
And… drum roll… that’s it. You can now explore your Facebook Ad Insights data in Looker to your heart’s content and create dashboards that your leadership and teammates can consume without logging into Facebook or relying on its limited reporting capabilities.
Feel free to reach out if you run into any issues with any of the above – I’m happy to help.
Lastly, if you found this helpful, I encourage you to join the newsletter as there will be several more posts like this in the coming weeks including how to model AdWords and DCM data as well as how to combine all of these into a single report.