
A recurring topic of discussion on the OpenAI forums, on Reddit, and on Twitter is about what ChatGPT’s knowledge cutoff date actually is. It seems like it should be straightforward enough to figure out (just ask it), but it can be confusing due to ChatGPT’s inconsistent answers about its cutoff month, differences from official documentation, and varying capabilities between the API and playground.
ChatGPT’s knowledge cutoff is of interest to me because I run Preceden, an AI timeline maker, and when users request to generate a timeline about a recent event, I need to know whether the ChatGPT API will respond with reliable information about that topic.
In addition to the knowledge cutoff month, I was also curious to understand what GPT-4 Turbo’s knowledge cutoff of ‘April 2023’ actually means. This raises questions such as whether it refers to the beginning, end, or a point in between that month. I’m also interested in knowing if the quality of its knowledge declines as we approach that date, and whether it sometimes has knowledge about events after that date.
Seeking unambiguous, easily verifiable knowledge
How can we evaluate the accuracy of ChatGPT’s knowledge (or any LLM for that matter) over time?
After brainstorming a few options like news headlines and election results, I arrived at the same conclusion that some forum commenters did: ask ChatGPT about celebrity deaths and specifically, celebrity death dates.
While a bit morbid (similar to the well-known Titantic survival prediction challenge), celebrity death dates work well for our purpose because they are widely reported (increasing the odds that the LLM was exposed to them as part of its training data) and the LLM’s response is easy to verify (if the person died on Feb 10, 2023 but the LLM says they are alive or they died in March, then it’s clearly incorrect).
How we’ll go about this
USAToday has pages that list celebrity deaths each year, including an ongoing list for 2023.
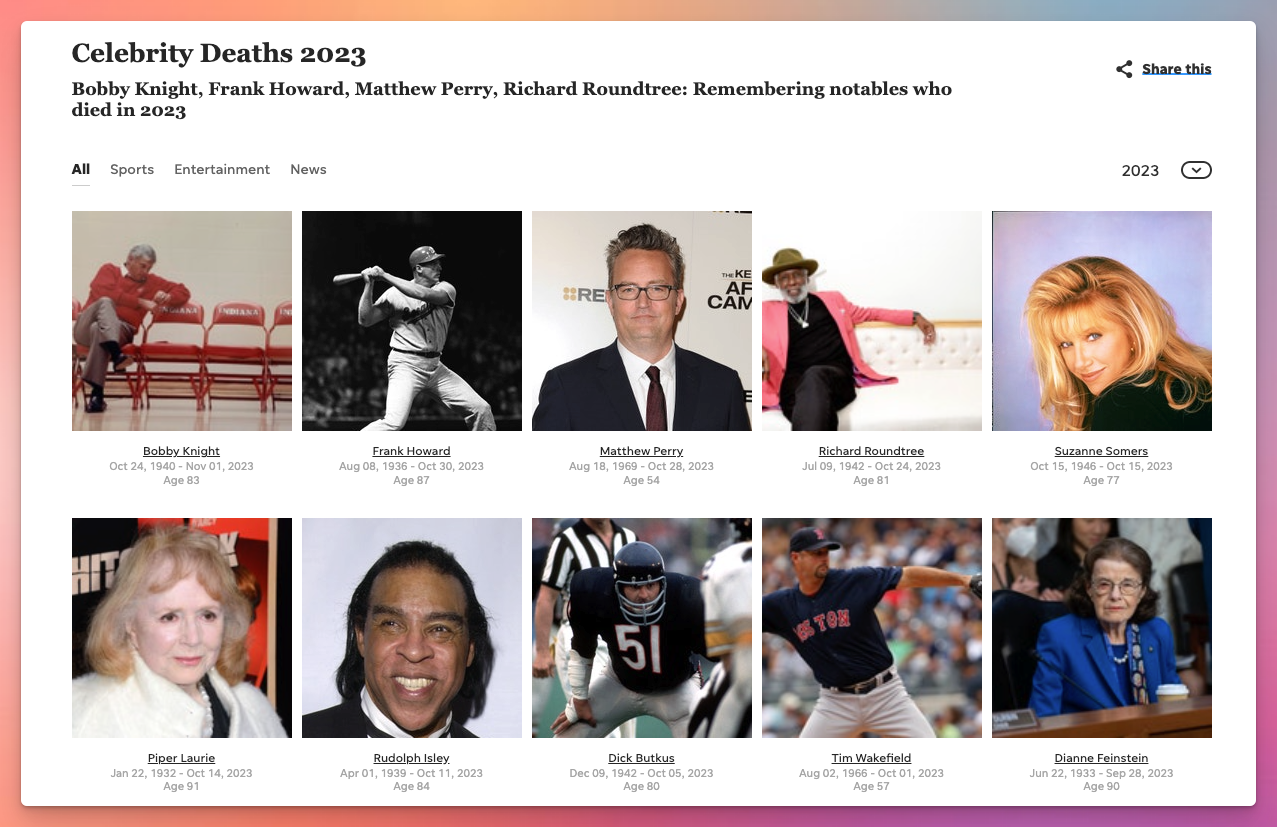
We’ll scrape that data to give us a list of 168 celebrities who have died between Jan 1, 2022 and August 1, 2023 (several months after GPT-4 Turbo’s official knowledge cutoff, so we can test whether it knows anything about more recent celebrity deaths).
We’ll then repeatedly ask the ChatGPT API about the deaths dates of the celebrities in that list. We’ll do this with multiple temperatures to minimize the impact the temperature might have on the results (temperature is a parameter that controls the “creativity” or randomness of the response).
Here’s what the prompt looks like (note that I’m including the celebrity’s birth date to avoid any ambiguity when there are multiple celebrities with the same name):
Given a list of celebrity names and their birth dates, generate a JSON object containing their death dates.
For example, given ‘Michael Jackson (1958-08-28)’, you should output: { “Michael Jackson”: “2009-06-25” }
If the person is still alive, return a blank string for their death date.
Now, return a JSON object containing every celebrity in this list:
1. Dan Reeves (1944-01-19)
2. Sidney Poitier (1927-02-20)
3. Peter Bogdanovich (1939-07-30)
4. Bob Saget (1956-05-17)
…
We’ll then compare ChatGPT’s knowledge about their death dates to the actual death dates to determine how accurate ChatGPT’s responses are. Occasionally GPT gives dates that are a day or two off, so I made a judgment call and am calling the date accurate as long as it is close to the actual death, indicating GPT is least aware that the celebrity had died, even if there is slight ambiguity about the exact date, possibly stemming from when the death occurred vs when it was reported.
Finally, we’ll analyze the results to see how often ChatGPT returned an accurate response.
You can find the source code for the USA Today scraper in this celebrity-deaths-scraper repo and the full source code for the Jupyter Notebook used in this analysis in this llm-knowledge-cutoff repo. While this analysis focuses on GPT-4 Turbo, the notebook is easy enough to customize for other ChatGPT models or other LLMs for anyone interested in continuing this work.
Things to keep in mind going into this
- I don’t have a deep understanding of how LLMs work which may lead me to interpret some of these results incorrectly. If you spot anything I’ve overlooked in this analysis, please share in a comment, drop me an email, or let me know on X and I’ll update this post accordingly.
- There could be subtle things like the wording I used in the prompt, the order of the celebrities, etc that is causing issues. Similar to the last point, if you notice anything like that, please let me know.
- It’s likely that OpenAI is tweaking these ChatGPT models frequently which may causes differences between the results below and what you see in the future if you run this notebook.
What does gpt-4-1106-preview know?
Overall GPT-4 does fairly well returning accurate celebrity death dates prior to 2023, but as we approach its knowledge cutoff, the probability that it returns an correct response declines significantly.

For example, there were 13 celebrities who passed away in January 2022 and we asked ChatGPT about each of them 50 times (10 times for each of the 5 temperatures), resulting in 650 responses. Out of those 650 responses, 596 were accurate, so the accuracy % for that month is 91.69%.
However, when we look at January 2023, which also saw 13 deaths, only 501 responses were correct, for an accuracy rate of 77%. By March 2023, only 210/450 or 44% of the responses were correct.
This chart also answers the question about what the April 2023 knowledge cutoff represents: it appears to mean GPT-4 Turbo was trained on data prior to April 2023 and not including that month. I can’t say for certain that’s true of 100% of its knowledge, but at least in terms of celebrity deaths, it’s not aware of anything from April 1st onward.
You may wonder as well what impact temperature had on the results. Not much:

Across each of the 5 temperatures it evaluated (0, 0.25, 5, 0.75, and 1), the accuracy of GPT-4 Turbo’s responses over these 168 celebrities was very similar.
Here’s how it does for each celebrity:
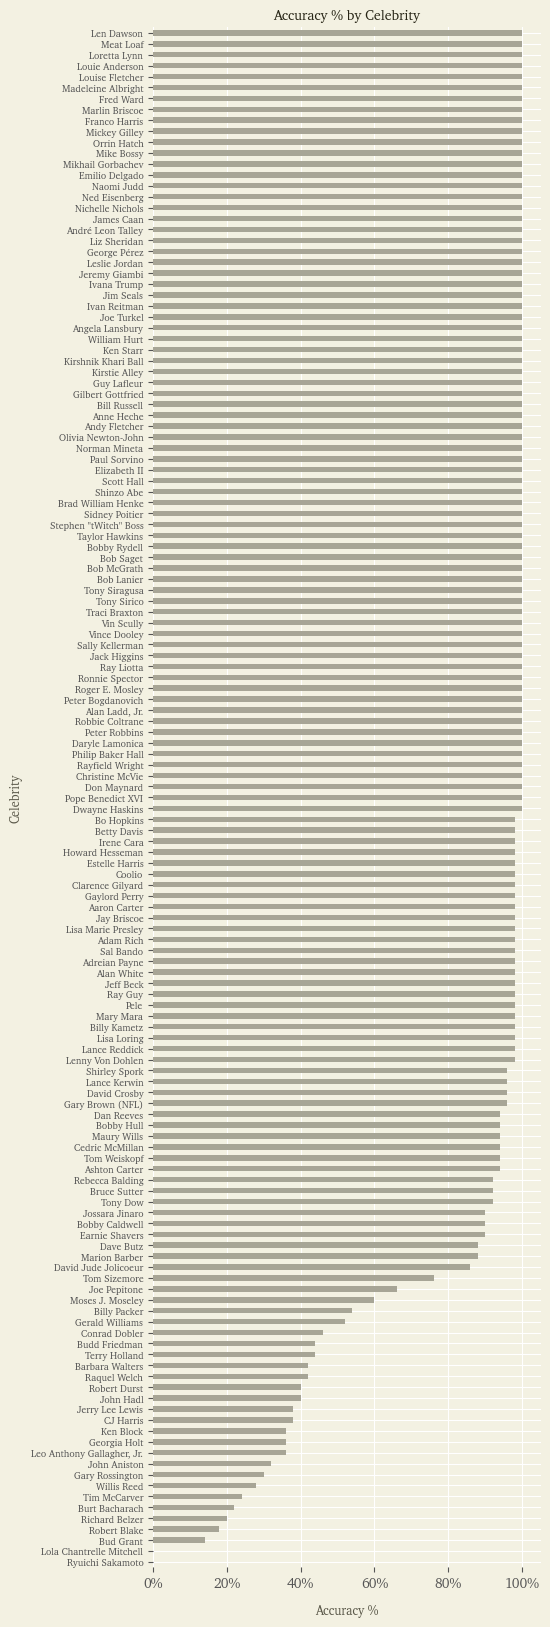
Many of the celebrities it returns the correct date for 100% of the time as we can see from the top half of that chart.
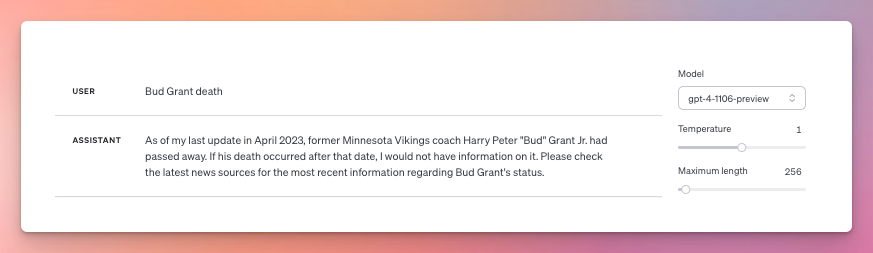
For others, ChatGPT will sometimes say the person is still alive, other times that he or she passed away. For example, Bud Grant, a former Minnesota Vikings coach, died on March 11, 2023 so in theory should be part of GPT-4 Turbo’s knowledge. However, sometimes the API returns a correct death date for him in the script, but often not. Ditto if you ask the playground about him. Here it responds he’s still alive:

But here it responds that he has indeed passed away:
And for two celebrities, ChatGPT never returned a correct date for their death:
- Ryuichi Sakamoto, a Japanese composer who died on March 28, 2023. His death doesn’t seem to have been reported until April 2, after a April 1 knowledge cutoff, so would make sense that ChatGPT wouldn’t know about it.
- Lola Chantrelle Mitchell, a former member of Three 6 Mafia, who died on January 1, 2023. I asked about her on X and someone received a correct response, but he hasn’t been able to reproduce it and I haven’t seen it in my testing. I’m stumped on why its having such trouble with her, given that her death was widely reported at the beginning of 2023.
Again, the probabilistic nature of LLMs means that there is inherent randomness in its responses. But why does it return 100% correct responses for some celebrities, 5-10% for others, and 0% for yet others? What about its training makes that happen? I asked GPT-4 Turbo and here is its response which I suspect answers it well:
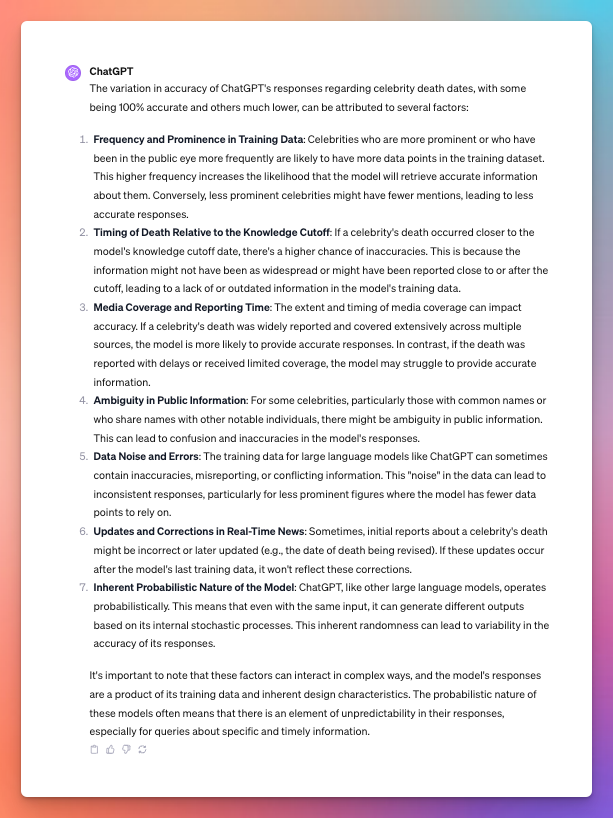
This highlights the need to not only consider the possibility of hallucinations in ChatGPT’s responses, but in the possibility of ignorance as well, especially for information about recent events. This will be less of an issue if you’re using GPT-4 with browsing enabled, but will still impact older models as well as usage of GPT-4 via the API or playground.
Again, if anyone spots anything I’ve overlooked in this analysis, please drop me a note.
Thanks for reading 👋.