
Back in April of this year Help Scout announced we would be raising prices for customers on some of our old legacy plans in six months time (in October). I recently helped with an analysis to estimate what the impact would be on our monthly recurring revenue (MRR). We performed a similar analysis prior to the announcement, but severals months had passed so it was time for fresh forecast.
At a high level, we performed the analysis as follows:
1. Identify the variables that impact the forecast
For us, this meant variables such as:
- Of of the customers who we announced the price increase for in April, how many have churned between then and now? And how many can we expect to churn between now and October? And how many can we expect to churn after the price increase?
- How many can we expect to upgrade or downgrade after the price increase?
- How many can we expect to change from monthly payments to discounted annual payments?
- Because customers pay per user, what % of users can we expect to lose after the price increase?
- And so on.
2. Create a spreadsheet that lets you adjust the variables to see what impact they have on the forecast
For example (and simplifying a lot), if we had W customers originally and X have churned between the announcement and now, and we expect another Y to churn between now and the price increase, and we expect Z% to churn after the price increase, paying $N/month on average, we’ll wind up with a future MRR of (W – X – Y) * (1 – Z) * N.
Our actual spreadsheet wound up become quite complex to take into account all of the variables, but in the end we had something that took into account all of the key factors that impact will the outcome.
3. Come up with a range of estimates for each of variable
Using historic trends and educated guesses, we estimated the range for each of the key variables we identified. With those in hand, we create several forecasts (pessmistic, realistic, optimistic) showing what the outcome looks like for each of those situations:
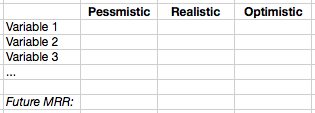
My original instinct was to come back with a single number: “The forecast is $X” but my lead wisely suggested calculating several outcomes to account for the range of possibilities.
This was a fascinating exercise because it forced us understand on a deep level what the inputs are (churn rate, etc) and what impact they have on our bottom line (MRR).
If you’re interested in trying this for your business, try to create a simple spreadsheet model that takes into account various metrics (number of unique visitors, trial sign up rate, trial to paid rate, etc) that comes close to predicting your historic results, then see how it well it does going forward. You’ll likely learn a lot in the process about which metrics you need to change and by how much to achieve your growth goals.

Very useful idea Matt. If could share a template it would help a lot. I do realize is best that we create our own models, but for people beginning with this, like myself, an example would help.
Hey, thanks for the comment. The reason I didn’t share a template is simply because the variables will differ so much from service to service. It’s worth building it from scratch to make sure you don’t miss anything important. If I can help at all feel free to shoot me an email.