Wrangling dbt Database Permissions

One of the more time consuming aspects of getting dbt working for me has been figuring out how to set the correct database permissions. I’m comfortable analyzing data once it’s in a data warehouse, but haven’t have a ton of experience actually setting one up. This post is for anyone else in a similar spot looking to set up dbt.

For some context going into this, I’m using Amazon RDS for Postgres with Heroku data made available by Stitch.

Big picture, to summarize Martin Melin who gave me some tips on this on dbt Slack, is for each person to have a user with full access to its own dedicated schema and read-only access to the source schemas.

For a quick key on the different roles in my setup:

  • mhmazur: The superuser
  • mazur: The dbt user
  • stitch: For Stitch to use
  • mode: For Mode to use

1) Create a user for dbt to use to connect to your data warehouse

With the exception of step 4, all of these need to be run from a superuser account:

-- As mhmazur
create role mazur with login password '...';

These are the credentials you’ll set in your profile.yml file for dbt to use to connect to your data warehouse.

2) Create an analytics schema

-- As mhmazur
create schema analytics;

This is where the production views and tables that dbt creates will exist. Your BI tools and analyses will use this data.

You could also set one up for development (and adjust the commands below accordingly) by changing the schema name to something like “dbt_mazur”.

If you tried to run dbt at this point, you’d get an error like “permission denied for schema analytics” because the dbt user doesn’t have access to it yet.

3) Give the dbt user full access to the analytics schema

-- As mhmazur
grant all on schema analytics to mazur;

Almost there! If you tried to run dbt now, you would get a different error: “permission denied for schema preceden_heroku” because the user doesn’t have access to the sources tables yet.

4) Make the dbt user the owner of the schema

-- As mhmazur
alter schema analytics owner to mazur;

This is necessary because when you created the schema, your superuser role became its owner. We need our dbt user to be the owner so that it can grant usage permissions from dbt hooks (see down below).

5) Finally, give the dbt user read-only access to the source tables

In order to transform the data, dbt needs to be able to query the source tables. In my case, the source tables live in a “preceden_heroku” schema owned by a “stitch” user. Therefore, to grant read-only access to the dbt user, I have to log in as the “stitch” user and run the following:

-- As stitch
grant usage on schema preceden_heroku to mazur;
grant select on all tables in schema preceden_heroku to mazur;

The last command is necessary even if you don’t materialize any models as tables because it also grants select permissions on views as well (even though it just says “tables” in the command). Per the docs: “note that ALL TABLES is considered to include views”.

Undoing these changes

You may run into issues and need to reverse these changes. Here’s how:

From the “stitch” user, revoke the read-only rights you gave to the user:

-- As stitch
revoke usage on schema preceden_heroku from mazur;
revoke all privileges on all tables in schema preceden_heroku from mazur;

Then from the dbt user (“mazur” in my case) change the owner back to your superuser:

-- As mazur
alter schema analytics owner to mhmazur;

Then back from your super user account (“mhmazur” for me), revoke permissions to the analytics schema:

-- As mhmazur
revoke all on schema analytics from mazur;

And then remove the analytics schema:

-- As mhmazur
drop schema analytics cascade;

And finally remove the user:

-- As mhmazur 
drop role mazur;

Granting read-only access to the analytics schema

One last thing: you’ll want to grant read-only access to the analytics schema so that your BI tool can execute queries. As the dbt user, run:

-- As mazur
grant usage on schema analytics to mode;
grant select on all tables in schema analytics to mode;

You’ll want to set this up as a hook so that whenever dbt changes the views and tables your BI maintains the correct permissions:

on-run-end:
 - 'grant usage on schema "{{ target.schema }}" to mode'
 - 'grant select on all tables in schema "{{ target.schema }}" to mode'

If you don’t do this, you’ll wind up getting a “permission denied for schema ______” or “permission denied for relation ______” error in your BI tool.

Happy querying!

Using Macros in dbt to Select Different Table Names in Development and Production

I’ve been experimenting a lot with dbt, a command line tool for transforming data within a data warehouse. I’ll have more to write about dbt later, but want to share a few lessons learned as I work through it for anyone else Googling for solutions in the future.

Here’s a problem I ran into and how to solve it:

In my development environment, I have an exact copy of my production Postgres database. For example, I can run a query like:

select count(*) from users;

In my data warehouse, the tables are created by Stitch which automatically adds the tables to a schema. To query for the number of users in the data warehouse, I have to prepend the schema to the table name:

select count(*) from preceden_heroku.users;

This presents a slight challenge for configuring dbt. It’s a best practice to use variables to set table names that way if the table name changes in the future, you can just adjust the variable and all of the models that depend on it will continue to work correctly:


vars:
"base.users" : "users"

view raw

base-table.yml

hosted with ❤ by GitHub


select
id,
email
from {{ var('base.users') }}

view raw

base-model.sql

hosted with ❤ by GitHub

However, with my setup, the table names differ between development and production so I can’t use this setup without some adjustment.

Macros to the rescue

I asked in the dbt Slack group how to work around this and Drew Banin, one of dbt’s creators, recommend using a macro. Macros are snippets of code that you can use in your dbt models like functions.

We can create a macro that accepts a table name and adjusts it based on whether dbt is being run in development or production:


{% macro source(table_name) %}
{% if target.name == 'prod' %}
{{ return("preceden_heroku." ~ table_name) }}
{% else %}
{{ return(table_name) }}
{% endif %}
{% endmacro %}

view raw

dbt-source.sql

hosted with ❤ by GitHub

In development, if we pass in an argument like “users”, the macro will simply return “users”. If production, it will prepend the table name with the schema name to return “preceden_heroku.users”.

Then we can use the this macro in the model by passing in the table name (via the variable) to have dbt use table names without a schema in development and table names with a schema in production:


select
id,
email
from {{ source(var('base.users')) }}

Easy peasy :)

Removing Query Parameters and Fragments from URLs with SQL

If you’re working with Mixpanel data, it’s important to keep in mind that current_url property represents the the full URL including query parameters and fragements. Here are a few examples, screenshots courtesy of the Chrome Mixpanel Debugger Extension:

https://www.helpscout.net/blog/

Screen Shot 2018-05-15 at 9.04.24 AM.png

https://www.helpscout.net/blog/?utm_source=example

Screen Shot 2018-05-15 at 9.04.59 AM.png

https://www.helpscout.net/blog/?utm_source=example#fragment

Screen Shot 2018-05-15 at 9.05.38 AM.png

You get the idea: The current_url property is the exact URL as displayed in the browser, query parameters and all.

This is an issue because if we’re analyzing the data to determine the number of unique visitors to a page, the query paramters and fragments shouldn’t have an impact. These should all be treated as the same page:

Without adjusting the query to take into account that these are all the same page, we’d wind up undercounting the number of visitors to it because we’d only wind up counting the version without query paramters or fragements.

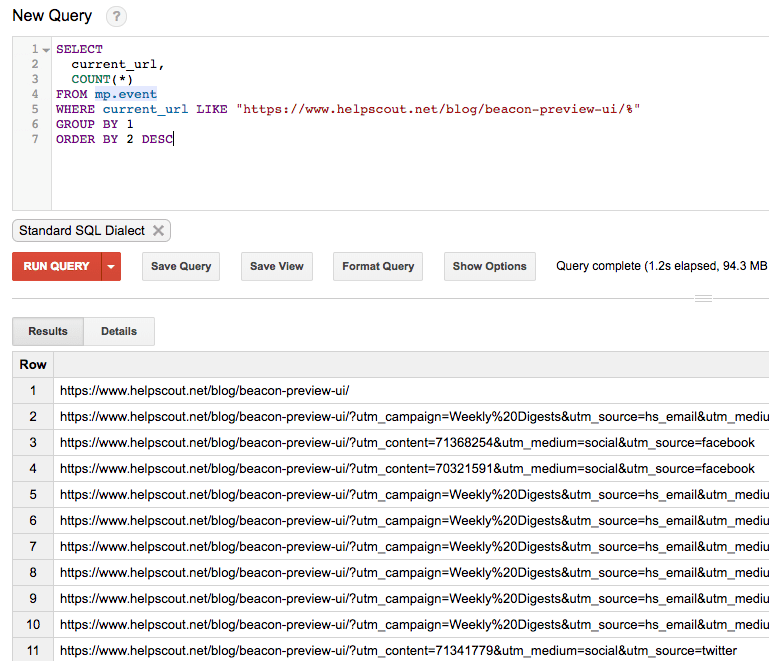
Take a look at just a fraction of the URLs our visitors had when viewing a single blog post (this Mixpanel data is in BigQuery thanks to Fivetran’s Mixpanel connector):

Screen Shot 2018-05-15 at 9.23.46 AM.png

Thanks to our marketing efforts, we actually had more visitors to the post with query parameters than there were to the same post without URL parameters.

Fortunately, removing the URL parameters and fragment is relatively straightforward using Standard SQL’s STRPOS AND SUBSTR:


SELECT
current_url,
CASE
WHEN STRPOS(current_url, "?") > 0 THEN SUBSTR(current_url, 0, STRPOS(current_url, "?") – 1)
WHEN STRPOS(current_url, "#") > 0 THEN SUBSTR(current_url, 0, STRPOS(current_url, "#") – 1)
ELSE current_url
END AS url
FROM (
SELECT 'https://www.helpscout.net/blog/beacon-preview-ui/' AS current_url
UNION ALL SELECT 'https://www.helpscout.net/blog/beacon-preview-ui/?utm_content=1234&utm_medium=social&utm_source=twitter' AS current_url
UNION ALL SELECT 'https://www.helpscout.net/blog/beacon-preview-ui/#example' AS current_url
);
+———————————————————————————————————+—————————————————+
| current_url | url |
+———————————————————————————————————+—————————————————+
| https://www.helpscout.net/blog/beacon-preview-ui/ | https://www.helpscout.net/blog/beacon-preview-ui/ |
| https://www.helpscout.net/blog/beacon-preview-ui/?utm_content=1234&utm_medium=social&utm_source=twitter | https://www.helpscout.net/blog/beacon-preview-ui/ |
| https://www.helpscout.net/blog/beacon-preview-ui/#example | https://www.helpscout.net/blog/beacon-preview-ui/ |
+———————————————————————————————————+—————————————————+

With that adjustment made, you can easily count the number of page views or unique visitors to a given page, regardless of URL parameters or fragements.

Tracking Daily Unique Visitors to Recently Published Blog Posts with Looker, Fivetran, Mixpanel, and BigQuery

If you work at a company that publishes a lot of content, it’s important to understand how well that content is performing. Not just in terms of page views and unique visitors, but whether it converts visitors into trials, etc.

At Help Scout we have a Looker dashboard to help us track all of these things and more. In this post, I’ll walk you through how we track the daily unique visitors to our recently published blog posts. For example, on May 2nd we published April’s Release Notes – how many people viewed that post on the day it was published? How about the day after? And how does that compare to our other recently published content?

Overview

Big picture, we fire a Viewed Page Mixpanel event on every marketing page. We then use Fivetran to get that event data into BigQuery, where we analyze it in Looker. You can read more about the setup here: Tracking What Pages Your Visitors View Prior to Signing Up Using Mixpanel, Fivetran, BigQuery, and Looker.

Querying for Recently Published Posts

With this data in hand, we need to figure out a way to determine what the recent blog posts were so that we can limit our analysis to them.

Here’s the query we use:


SELECT
current_url,
MIN(TIMESTAMP_TRUNC(time, DAY)) AS published_at
FROM mp.event
WHERE
current_url like "https://www.helpscout.net/blog/%"
GROUP BY 1
HAVING
COUNT(*) > 200 AND
MIN(time) >= "2018-04-04"
ORDER BY 2 DESC

For Help Scout blog URLs (ie, URLs that begin with https://www.helpscout.net/blog/), we need to determine when the post was published. That’s the same as the first day it was viewed. However, because we launched Mixpanel page view tracking on April 3rd, this would make it look like every one of our posts was published on April 3rd or sometime after that. That’s why we limit the results to April 4th or later. Also, we want to limit it to posts that received at least a certain number of visitors that first day, otherwise the results will wind up including low traffic posts that were first viewed after April 4th.

This query gets us a list of those recently published posts:


+———————————————————————-+——————————–+
| current_url | published_at |
+———————————————————————-+——————————–+
| https://www.helpscout.net/blog/customer-intimacy/ | 2018-05-03 00:00:00.000000 UTC |
| https://www.helpscout.net/blog/april-2018-release-notes/ | 2018-05-02 00:00:00.000000 UTC |
| https://www.helpscout.net/blog/data-security-breach/ | 2018-04-26 00:00:00.000000 UTC |
| https://www.helpscout.net/blog/beacon-preview-ui/ | 2018-04-19 00:00:00.000000 UTC |
| https://www.helpscout.net/blog/customer-service-employee-engagement/ | 2018-04-05 00:00:00.000000 UTC |
| https://www.helpscout.net/blog/march-2018-release-notes/ | 2018-04-04 00:00:00.000000 UTC |
+———————————————————————-+——————————–+

Modeling the Data in Looker

Over in Looker, we’re going to create a derived table with these results so that we can determine whether a given Mixpanel event URL is a recently published blog post:


view: mp_new_blog_content {
derived_table: {
sql:
SELECT
current_url,
MIN(TIMESTAMP_TRUNC(time, DAY)) AS published_at
FROM mp.event
WHERE
current_url like "https://www.helpscout.net/blog/%"
GROUP BY 1
HAVING
COUNT(*) > 200 AND
MIN(time) >= "2018-04-04"
ORDER BY 2 DESC ;;
sql_trigger_value: FORMAT_DATETIME("%Y-%m-%d-%H", CURRENT_DATETIME()) ;;
}
dimension: current_url {
type: string
sql: ${TABLE}.current_url ;;
hidden: yes
}
dimension: is_new_blog_content {
label: "Is New Blog Content?"
type: yesno
sql: ${blog_post_publish_date} IS NOT NULL ;;
}
dimension_group: blog_post_publish {
type: time
timeframes: [
date,
week,
month,
quarter,
year
]
sql: ${TABLE}.published_at ;;
}
}

The reason we have the is_new_blog_content dimension here is because we’re going to LEFT JOIN all Mixpanel events on this derived table by the URL. Not all URLs will have a match in this table, so this dimension will let us limit the analysis to just events that were a recently published blog post.

Here’s how we model the relationship between our main Mixpanel events model and this derived table:


explore: mp_events {
view_label: "Mixpanel"
label: "Mixpanel"
join: mp_new_blog_content {
view_label: "Mixpanel"
type: left_outer
relationship: many_to_one
sql_on: ${mp_new_blog_content.current_url} = ${mp_events.current_url} ;;
}
}

One other key piece of this is that we model how to calculate unique visitors in the main Mixpanel events view:


view: mp_events {
sql_table_name: mp.event ;;
# …
measure: unique_visitors {
type: count_distinct
sql: ${distinct_id} ;;
}
}

Creating the Chart in Looker

With these foundations in place, we can then create the chart we set out to.

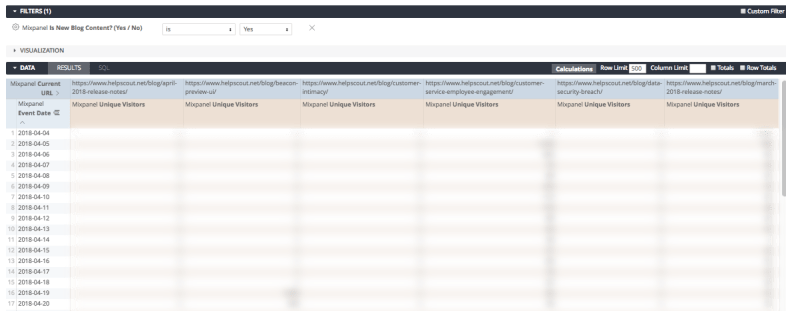
We want to use that Is New Blog Content dimension to limit the results to recently published posts, then pivot the daily unique visitor count on the URL:

looker-recent-posts-explore.png

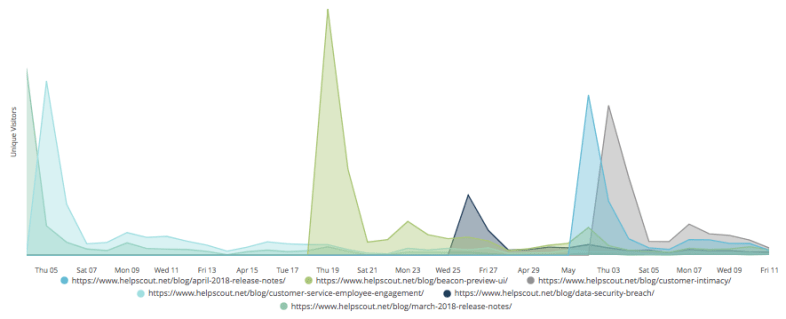
Then it’s just a matter of setting up the chart in Looker and voila, there we have it:

Screen Shot 2018-05-11 at 1.51.34 PM.png

Going forward, without anyone having to log into Google Analyics, we’ll be able to track the popularity of our new blog posts and track the trends over time.

By the way, that spike on April 19th is from our CEO’s Beacon 2.0 Preview: The User Interface post, all about Help Scout’s soon-to-be-released live chat & improved self service tool. If you’re interested in getting notified when it launches, you can sign up here.

Happy querying!