
One of the things we’ve been analyzing at Help Scout recently is what paths individual companies take before signing up for a trial. For example, looking at a company that signed up last month, did they start their journey with Help Scout on our homepage? Or did they find us via our blog? Or one of our marketing landing pages? And once we know that, what other pages did they visit before signing up? Did that company wind up becoming a customer? How much did we make from them?
This post is about how we’ve wrangled the data using Mixpanel, Fivetran, BigQuery, and Looker to help us answer these questions.
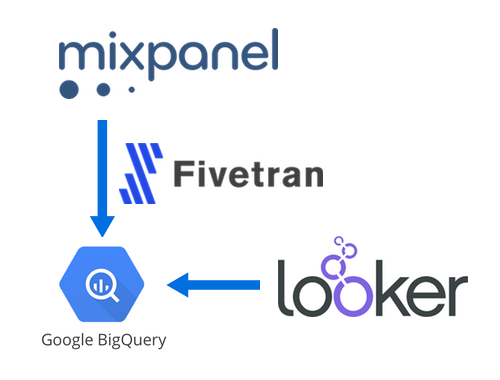
Big picture, we’re tracking page view and sign up events in Mixpanel, syncing that data to BigQuery using Fivetran, then tying it to our internal company data in Looker for easy analysis.
Step 1: Tracking Page Views and Sign Ups in Mixpanel
If you’ve used an event-based analytics service, this step will be pretty straightforward. We load the Mixpanel script on every page, then fire a Viewed Page event:
This file contains hidden or bidirectional Unicode text that may be interpreted or compiled differently than what appears below. To review, open the file in an editor that reveals hidden Unicode characters.
Learn more about bidirectional Unicode characters
| <script> | |
| mixpanel.track("Viewed Page"); | |
| </script> |
And then if the company signs up for a trial, we fire a Signed Up event with that company’s id as a property:
This file contains hidden or bidirectional Unicode text that may be interpreted or compiled differently than what appears below. To review, open the file in an editor that reveals hidden Unicode characters.
Learn more about bidirectional Unicode characters
| mixpanel.track("Signed Up", { | |
| com_id: comId | |
| }); |
These are the only two Mixpanel events we track. If we wanted to track actions in-app, we could also fire custom events for those, but we don’t at Help Scout because we tie this Mixpanel data together with our internal data about what companies have done in-app, eliminating the need for additional Mixpanel events.
Here’s what the Viewed Page event looks like in Mixpanel’s Live View:
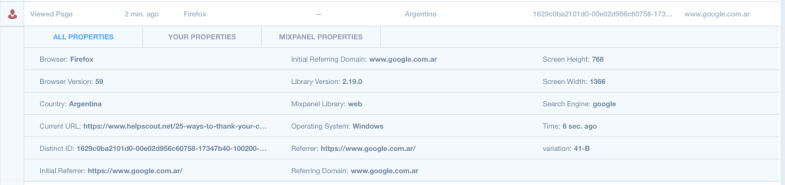
Also as we’ll see later, Mixpanel automatically tracks a lot of details about the visitor: things like the browser, country, URL, referrer, OS, etc, all of which we can use use in our analyses.
Step 2: Syncing Mixpanel data to BigQuery with Fivetran
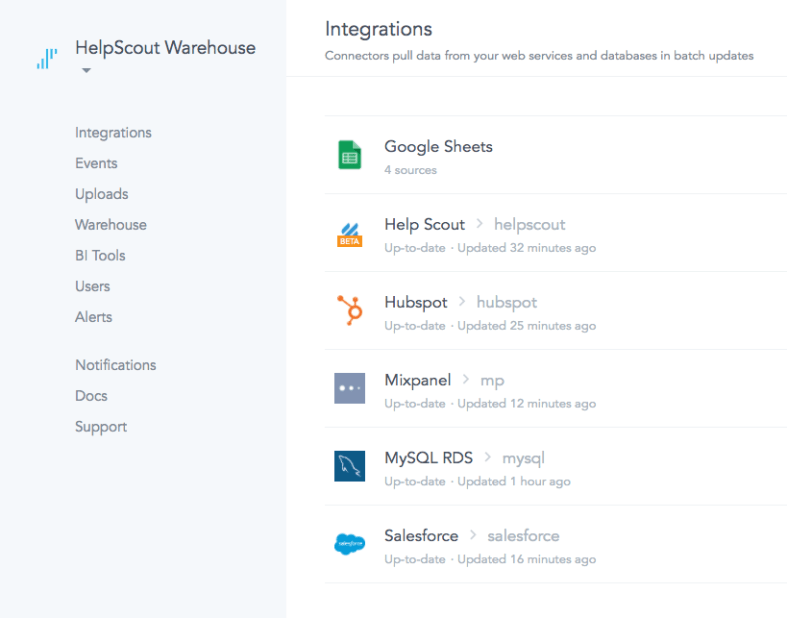
Fivetran is this amazing service that specializes in helping you centralize all of your data in a data warehouse. For example, we have Fivetran connectors set up for MySQL (which we use internally at Help Scout), Salesforce, HubSpot, Google Sheets, and now Mixpanel:
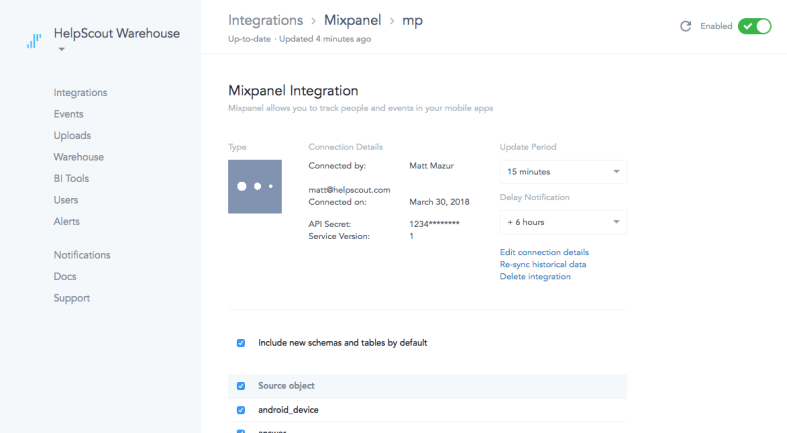
Taking Mixpanel as an example, we provide Fivetran out Mixpanel API credentials, then Fivetran queries Mixpanel’s API periodically, cleans up the results, and throws it all in BigQuery:
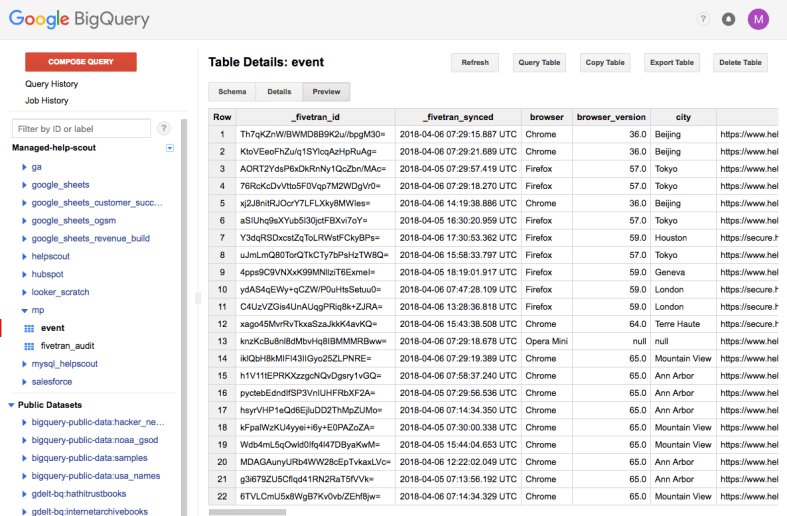
This lets us analyze our Mixpanel data just like we would other SQL data:
This file contains hidden or bidirectional Unicode text that may be interpreted or compiled differently than what appears below. To review, open the file in an editor that reveals hidden Unicode characters.
Learn more about bidirectional Unicode characters
| SELECT COUNT(*) FROM mp.event WHERE city = "Tokyo" AND DATE(time) = "2018-04-03" |
We can also access the custom event properties that we’re tracking for the Signed Up event using Standard SQL’s json_extract_scalar function:
This file contains hidden or bidirectional Unicode text that may be interpreted or compiled differently than what appears below. To review, open the file in an editor that reveals hidden Unicode characters.
Learn more about bidirectional Unicode characters
| SELECT | |
| properties, | |
| JSON_EXTRACT_SCALAR(properties, "$.com_id") AS com_id | |
| FROM mp.event | |
| WHERE name = "Signed Up" | |
| LIMIT 1 | |
| +—————–+——–+ | |
| | properties | com_id | | |
| +—————–+——–+ | |
| | {"com_id":1234} | 1234 | | |
| +—————–+——–+ |
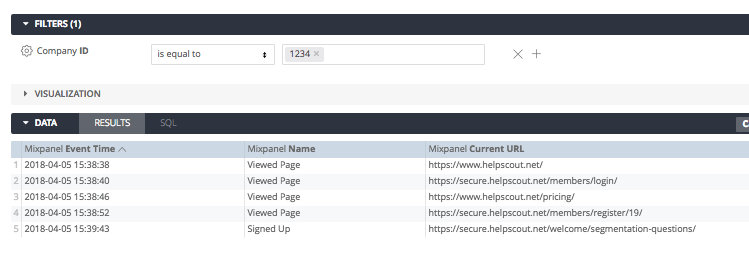
Once we have the company id, it’s just a matter of querying for a specific company id to view their event history:
This file contains hidden or bidirectional Unicode text that may be interpreted or compiled differently than what appears below. To review, open the file in an editor that reveals hidden Unicode characters.
Learn more about bidirectional Unicode characters
| SELECT | |
| time, | |
| name, | |
| current_url | |
| FROM ( | |
| SELECT | |
| distinct_id, | |
| CAST(JSON_EXTRACT_SCALAR(properties, "$.com_id") AS INT64) AS com_id | |
| FROM mp.event | |
| WHERE name = "Signed Up" | |
| ) signed_up | |
| JOIN mp.event ON event.distinct_id = signed_up.distinct_id | |
| WHERE signed_up.com_id = 1234 | |
| ORDER BY time ASC | |
| +——————————–+————-+————————————————————–+ | |
| | time | name | current_url | | |
| +——————————–+————-+————————————————————–+ | |
| | 2018-04-05 15:38:38.000000 UTC | Viewed Page | https://www.helpscout.net/ | | |
| | 2018-04-05 15:38:40.000000 UTC | Viewed Page | https://secure.helpscout.net/members/login/ | | |
| | 2018-04-05 15:38:46.000000 UTC | Viewed Page | https://www.helpscout.net/pricing/ | | |
| | 2018-04-05 15:38:52.000000 UTC | Viewed Page | https://secure.helpscout.net/members/register/19/ | | |
| | 2018-04-05 15:39:43.000000 UTC | Signed Up | https://secure.helpscout.net/welcome/segmentation-questions/ | | |
| +——————————–+————-+————————————————————–+ |
Step 3: Modeling the data in Looker
If you have access to a Business Intelligence tool like Looker, you can model this Mixpanel data and how to join it with your other data.
First, create a view to model the Mixpanel event data:
This file contains hidden or bidirectional Unicode text that may be interpreted or compiled differently than what appears below. To review, open the file in an editor that reveals hidden Unicode characters.
Learn more about bidirectional Unicode characters
| view: mp_events { | |
| sql_table_name: mp.event ;; | |
| dimension: event_id { | |
| primary_key: yes | |
| type: number | |
| sql: ${TABLE}.event_id ;; | |
| } | |
| dimension: browser { | |
| type: string | |
| sql: ${TABLE}.browser ;; | |
| } | |
| dimension: browser_version { | |
| type: number | |
| sql: ${TABLE}.browser_version ;; | |
| } | |
| dimension: city { | |
| type: string | |
| sql: ${TABLE}.city ;; | |
| } | |
| dimension: full_url { | |
| type: string | |
| sql: ${TABLE}.current_url ;; | |
| } | |
| dimension: has_url_parameters { | |
| type: yesno | |
| hidden: yes | |
| sql: STRPOS(${full_url}, "?") > 0 ;; | |
| } | |
| dimension: current_url_without_parameters { | |
| hidden: yes | |
| label: "Current URL without Parameters" | |
| type: string | |
| sql: | |
| CASE | |
| WHEN ${has_url_parameters} THEN SUBSTR(${full_url}, 0, STRPOS(${full_url}, "?") – 1) | |
| ELSE ${full_url} | |
| END ;; | |
| } | |
| dimension: has_url_hash { | |
| type: yesno | |
| hidden: yes | |
| sql: STRPOS(${current_url_without_parameters}, "#") > 0 ;; | |
| } | |
| dimension: current_url { | |
| type: string | |
| sql: | |
| CASE | |
| WHEN ${has_url_hash} THEN SUBSTR(${current_url_without_parameters}, 0, STRPOS(${current_url_without_parameters}, "#") – 1) | |
| ELSE ${current_url_without_parameters} | |
| END ;; | |
| } | |
| dimension: current_url_path { | |
| type: string | |
| sql: SUBSTR(${current_url}, STRPOS(${current_url}, "helpscout.net") + LENGTH("helpscout.net")) ;; | |
| } | |
| dimension: device { | |
| type: string | |
| sql: ${TABLE}.device ;; | |
| } | |
| dimension: distinct_id { | |
| type: string | |
| sql: ${TABLE}.distinct_id ;; | |
| } | |
| dimension: initial_referrer { | |
| type: string | |
| sql: ${TABLE}.initial_referrer ;; | |
| } | |
| dimension: initial_referring_domain { | |
| type: string | |
| sql: ${TABLE}.initial_referring_domain ;; | |
| } | |
| dimension: lib_version { | |
| type: string | |
| sql: ${TABLE}.lib_version ;; | |
| } | |
| dimension: mp_country_code { | |
| type: string | |
| sql: ${TABLE}.mp_country_code ;; | |
| } | |
| dimension: mp_lib { | |
| type: string | |
| sql: ${TABLE}.mp_lib ;; | |
| } | |
| dimension: name { | |
| type: string | |
| sql: ${TABLE}.name ;; | |
| } | |
| dimension: os { | |
| type: string | |
| sql: ${TABLE}.os ;; | |
| } | |
| dimension: properties { | |
| type: string | |
| sql: ${TABLE}.properties ;; | |
| } | |
| dimension: referrer { | |
| type: string | |
| sql: ${TABLE}.referrer ;; | |
| } | |
| dimension: referring_domain { | |
| type: string | |
| sql: ${TABLE}.referring_domain ;; | |
| } | |
| dimension: region { | |
| type: string | |
| sql: ${TABLE}.region ;; | |
| } | |
| dimension: screen_height { | |
| type: number | |
| sql: ${TABLE}.screen_height ;; | |
| } | |
| dimension: screen_width { | |
| type: number | |
| sql: ${TABLE}.screen_width ;; | |
| } | |
| dimension: search_engine { | |
| type: string | |
| sql: ${TABLE}.search_engine ;; | |
| } | |
| dimension_group: time { | |
| label: "Event" | |
| type: time | |
| timeframes: [ | |
| raw, | |
| time, | |
| date, | |
| week, | |
| month, | |
| quarter, | |
| year | |
| ] | |
| sql: ${TABLE}.time ;; | |
| } | |
| dimension: utm_source { | |
| label: "UTM Source" | |
| type: string | |
| sql: JSON_EXTRACT_SCALAR(${properties}, "$.utm_source") ;; | |
| } | |
| dimension: utm_campaign { | |
| label: "UTM Campaign" | |
| type: string | |
| sql: JSON_EXTRACT_SCALAR(${properties}, "$.utm_campaign") ;; | |
| } | |
| dimension: utm_term { | |
| label: "UTM Term" | |
| type: string | |
| sql: JSON_EXTRACT_SCALAR(${properties}, "$.utm_term") ;; | |
| } | |
| dimension: utm_medium { | |
| label: "UTM Medium" | |
| type: string | |
| sql: JSON_EXTRACT_SCALAR(${properties}, "$.utm_medium") ;; | |
| } | |
| dimension: utm_content { | |
| label: "UTM Content" | |
| type: string | |
| sql: JSON_EXTRACT_SCALAR(${properties}, "$.utm_content") ;; | |
| } | |
| measure: count { | |
| label: "Total Events" | |
| type: count | |
| drill_fields: [event_id, name] | |
| } | |
| measure: unique_visitors { | |
| type: count_distinct | |
| sql: ${distinct_id} ;; | |
| } | |
| } |
Then create a view with a derived table to model the relationship between a distinct_id in Mixpanel with a company id:
This file contains hidden or bidirectional Unicode text that may be interpreted or compiled differently than what appears below. To review, open the file in an editor that reveals hidden Unicode characters.
Learn more about bidirectional Unicode characters
| view: mp_companies { | |
| derived_table: { | |
| sql: | |
| SELECT | |
| distinct_id, | |
| CAST(JSON_EXTRACT_SCALAR(properties, "$.com_id") AS INT64) AS com_id | |
| FROM mp.event | |
| WHERE name = "Signed Up" ;; | |
| } | |
| dimension: distinct_id { | |
| type: number | |
| sql: ${TABLE}.distinct_id ;; | |
| hidden: yes | |
| } | |
| dimension: com_id { | |
| label: "Company ID" | |
| type: number | |
| sql: ${TABLE}.com_id ;; | |
| } | |
| } |
Finally, connect those two views and any others you want to be able to analyze together:
This file contains hidden or bidirectional Unicode text that may be interpreted or compiled differently than what appears below. To review, open the file in an editor that reveals hidden Unicode characters.
Learn more about bidirectional Unicode characters
| connection: "bigquery" | |
| include: "*.view.lkml" | |
| explore: mp_events { | |
| view_label: "Mixpanel" | |
| label: "Mixpanel" | |
| sql_always_where: STRPOS(${full_url}, "https://www.helpscout.net") = 1 OR STRPOS(${full_url}, "https://secure.helpscout.net") = 1 ;; | |
| join: mp_companies { | |
| view_label: "Mixpanel" | |
| type: left_outer | |
| relationship: many_to_one | |
| sql_on: ${mp_companies.distinct_id} = ${mp_events.distinct_id} ;; | |
| } | |
| join: helpscout_companies { | |
| view_label: "Company" | |
| relationship: one_to_one | |
| sql_on: ${helpscout_companies.com_id} = ${mp_companies.com_id} ;; | |
| } | |
| } |
Step 4: Analyzing the data in Looker
Once you’ve modeled the data, you can analyze the event history for specific companies, track trends like page views and unique visitors, and more:
In future posts I’ll walk through some of the other interesting analyses you can perform with this data.
If you have any questions about this setup, don’t hesitate to reach out.

2 thoughts on “Tracking What Pages Your Visitors View Prior to Signing Up Using Mixpanel, Fivetran, BigQuery, and Looker”