Analyzing a Conversion Funnel in BigQuery Using Fivetran Powered Mixpanel Data

mixpanel-funnels_fqmumg.png

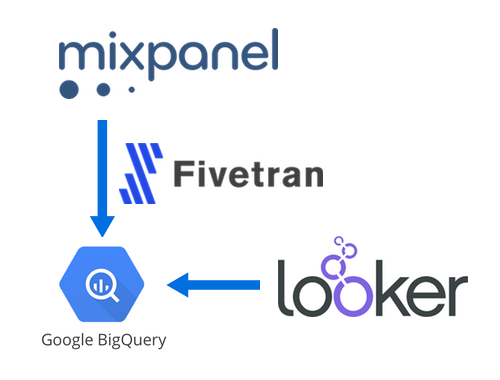
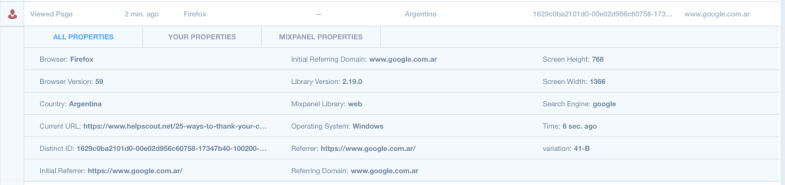
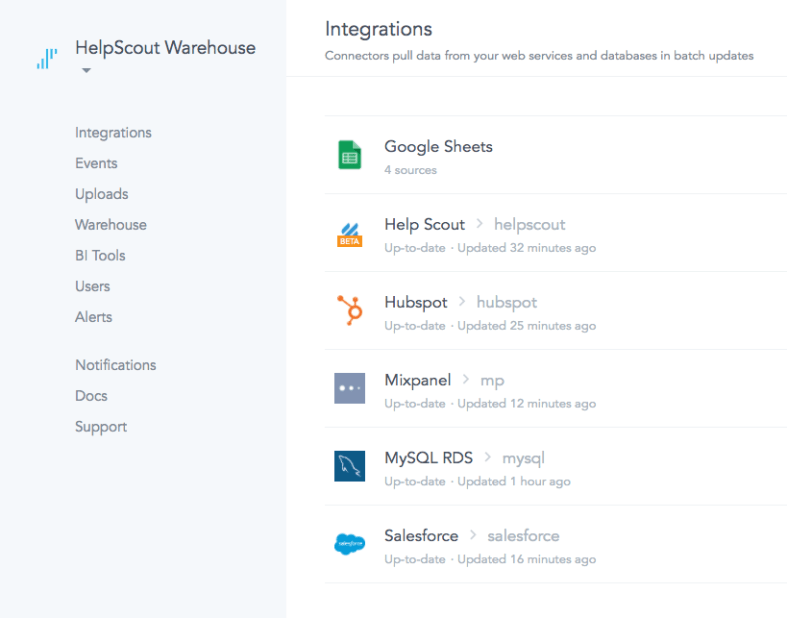
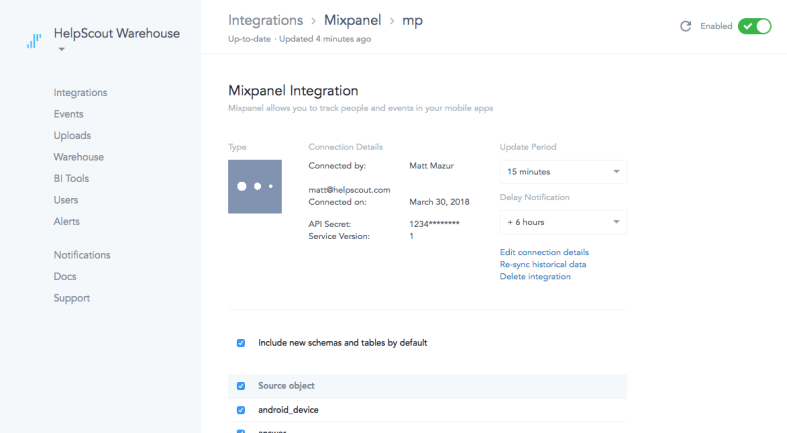
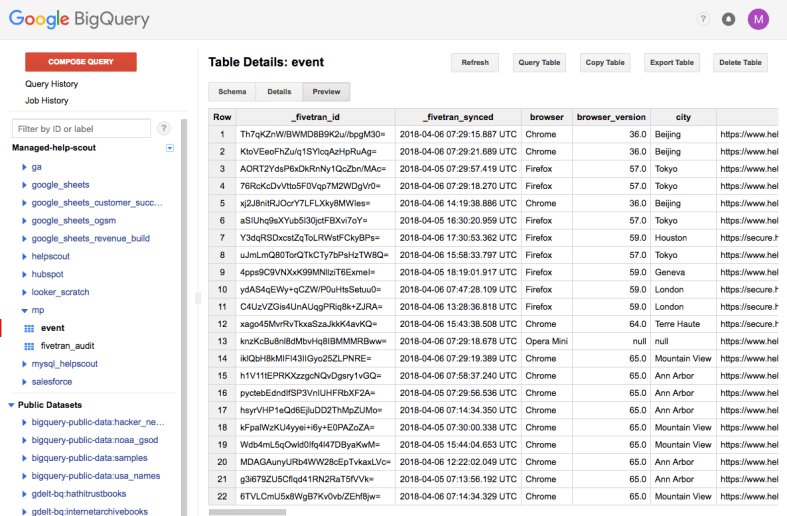
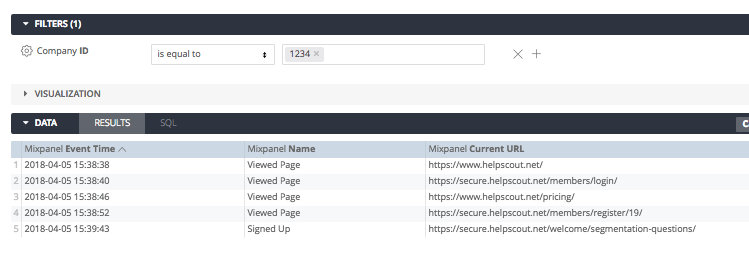
In a recent post I outlined how to use Fivetran to sync Mixpanel data to BigQuery for analysis in Looker. Today we’ll walk through how to write a SQL query to analyze a funnel using the Mixpanel data in BigQuery.

For this analysis, we’re going to create a three-step funnel showing how many visitors who start on Help Scout’s pricing page click through to the sign up page and then sign up.

One Step

To begin, lets just look at visitors who viewed the pricing page:


SELECT
distinct_id,
time AS viewed_pricing_at
FROM mp.event
WHERE
name = "Viewed Page" AND
current_url LIKE "https://www.helpscout.net/pricing/%"
+—————————————————-+——————————–+
| distinct_id | viewed_pricing_at |
+—————————————————-+——————————–+
| 1628dfc9f7e0-0184dcc4e-71615c5a-49a10-1628dfc9f800 | 2018-04-03 17:09:27.000000 UTC |
| 16291bd96456-01abc2a0f-87a6c72-2c880-16291bd9648ae | 2018-04-04 10:41:32.000000 UTC |
| 162936a4e6f37-01526b61-6b4b327d-25800-162936a4e738 | 2018-04-04 18:27:46.000000 UTC |
| 162a0381d481-0b3137c58-60031d3c-3d10d-162a0381d496 | 2018-04-07 06:10:35.000000 UTC |
+—————————————————-+——————————–+

You might wonder why we need the % at the end of the URL; that’s simply to make sure the results include pages with URL parameters such as https://www.helpscout.net/pricing/?utm_source=adwords.

Two Steps

Next, we’ll join these results on sign up page data, making sure that the sign up page views occurred after the pricing page views:


SELECT
pricing.distinct_id,
viewed_pricing_at,
viewed_sign_up_at
FROM (
SELECT
distinct_id,
time AS viewed_pricing_at
FROM mp.event
WHERE
name = "Viewed Page" AND
current_url LIKE "https://www.helpscout.net/pricing/%"
) pricing
LEFT JOIN (
SELECT
distinct_id,
time AS viewed_sign_up_at
FROM mp.event
WHERE
name = "Viewed Page" AND
current_url LIKE "https://secure.helpscout.net/members/register/%"
) sign_up_page ON sign_up_page.distinct_id = pricing.distinct_id AND sign_up_page.viewed_sign_up_at > viewed_pricing_at
+———————————————————–+——————————–+——————————–+
| distinct_id | viewed_pricing_at | viewed_sign_up_at |
+———————————————————–+——————————–+——————————–+
| 1628be3f8ab208-0678714f9f0ec-b34356b-1fa400-1628be3f8b825 | 2018-04-03 07:31:26.000000 UTC | 2018-04-09 06:08:08.000000 UTC |
| 1628be3f8ab208-0678714f9f0ec-b34356b-1fa400-1628be3f8b825 | 2018-04-05 12:48:37.000000 UTC | 2018-04-09 06:08:08.000000 UTC |
| 1628be3f8ab208-0678714f9f0ec-b34356b-1fa400-1628be3f8b825 | 2018-04-03 07:28:42.000000 UTC | 2018-04-09 06:08:08.000000 UTC |
| 1628be3f8ab208-0678714f9f0ec-b34356b-1fa400-1628be3f8b825 | 2018-04-03 07:27:49.000000 UTC | 2018-04-09 06:08:08.000000 UTC |
| 1628be3f8ab208-0678714f9f0ec-b34356b-1fa400-1628be3f8b825 | 2018-04-03 07:35:51.000000 UTC | 2018-04-09 06:08:08.000000 UTC |
| 162914788c5fb-09337b4c437dc4-b34356b-144000-162914788c628 | 2018-04-04 17:30:18.000000 UTC | |
+———————————————————–+——————————–+——————————–+

The reason we LEFT JOIN is because not all visitors will make it to the next step of the funnel and we want the data to reflect that.

Note that we join on both the distinct_id (to ensure each result is for a single visitor) and on the time the events occurred.

Three Steps

Extending this to the third and final step of the funnel, the Signed Up event, we get:


SELECT
pricing.distinct_id,
viewed_pricing_at,
viewed_sign_up_at,
signed_up_at
FROM (
SELECT
distinct_id,
time AS viewed_pricing_at
FROM mp.event
WHERE
name = "Viewed Page" AND
current_url LIKE "https://www.helpscout.net/pricing/%"
) pricing
LEFT JOIN (
SELECT
distinct_id,
time AS viewed_sign_up_at
FROM mp.event
WHERE
name = "Viewed Page" AND
current_url LIKE "https://secure.helpscout.net/members/register/%"
) sign_up_page ON sign_up_page.distinct_id = pricing.distinct_id AND sign_up_page.viewed_sign_up_at > viewed_pricing_at
LEFT JOIN (
SELECT
distinct_id,
time AS signed_up_at
FROM mp.event
WHERE
name = "Signed Up"
) signed_up ON signed_up.distinct_id = pricing.distinct_id AND signed_up.signed_up_at > viewed_sign_up_at
+———————————————————–+——————————–+——————————–+——————————–+
| distinct_id | viewed_pricing_at | viewed_sign_up_at | signed_up_at |
+———————————————————–+——————————–+——————————–+——————————–+
| 1628be3f8ab208-0678714f9f0ec-b34356b-1fa400-1628be3f8b825 | 2018-04-03 07:31:26.000000 UTC | 2018-04-09 06:08:08.000000 UTC | |
| 1628be3f8ab208-0678714f9f0ec-b34356b-1fa400-1628be3f8b825 | 2018-04-05 12:48:37.000000 UTC | 2018-04-09 06:08:08.000000 UTC | |
| 1628be3f8ab208-0678714f9f0ec-b34356b-1fa400-1628be3f8b825 | 2018-04-03 07:28:42.000000 UTC | 2018-04-09 06:08:08.000000 UTC | |
| 1628be3f8ab208-0678714f9f0ec-b34356b-1fa400-1628be3f8b825 | 2018-04-03 07:27:49.000000 UTC | 2018-04-09 06:08:08.000000 UTC | |
| 1628be3f8ab208-0678714f9f0ec-b34356b-1fa400-1628be3f8b825 | 2018-04-03 07:35:51.000000 UTC | 2018-04-09 06:08:08.000000 UTC | |
| 162914788c5fb-09337b4c437dc4-b34356b-144000-162914788c628 | 2018-04-04 17:30:18.000000 UTC | 2018-04-04 17:31:13.000000 UTC | 2018-04-04 17:34:51.000000 UTC |
| 162914788c5fb-09337b4c437dc4-b34356b-144000-162914788c628 | 2018-04-04 08:31:16.000000 UTC | 2018-04-04 17:24:52.000000 UTC | 2018-04-04 17:34:51.000000 UTC |
+———————————————————–+——————————–+——————————–+——————————–+

view raw

three-steps.sql

hosted with ❤ by GitHub

Determining the First Event Occurrence for Each Step

The query above will return every combination of pricing page views, sign up page views, and sign up events for each visitor. For our funnel though, we don’t care whether they loaded the pricing page or sign up page multiple times, we only care that they did it at all. So we modify the query to only return the first instance of each event for each visitor:


SELECT
pricing.distinct_id,
MIN(viewed_pricing_at) AS viewed_pricing_at,
MIN(viewed_sign_up_at) AS viewed_sign_up_at,
MIN(signed_up_at) AS signed_up_at
FROM (
SELECT
distinct_id,
time AS viewed_pricing_at
FROM mp.event
WHERE
name = "Viewed Page" AND
current_url LIKE "https://www.helpscout.net/pricing/%"
) pricing
LEFT JOIN (
SELECT
distinct_id,
time AS viewed_sign_up_at
FROM mp.event
WHERE
name = "Viewed Page" AND
current_url LIKE "https://secure.helpscout.net/members/register/%"
) sign_up_page ON sign_up_page.distinct_id = pricing.distinct_id AND sign_up_page.viewed_sign_up_at > viewed_pricing_at
LEFT JOIN (
SELECT
distinct_id,
time AS signed_up_at
FROM mp.event
WHERE
name = "Signed Up"
) signed_up ON signed_up.distinct_id = pricing.distinct_id AND signed_up.signed_up_at > viewed_sign_up_at
GROUP BY 1
+————————————————————–+——————————–+——————————–+——————————–+
| distinct_id | viewed_pricing_at | viewed_sign_up_at | signed_up_at |
+————————————————————–+——————————–+——————————–+——————————–+
| 162931933729b2-0b3ba365e6d865-336c7b05-384000-1629319337333b | 2018-04-04 16:58:45.000000 UTC | 2018-04-11 20:50:13.000000 UTC | 2018-04-11 20:51:46.000000 UTC |
| 162b770945247a-0145ce1cbf076d8-495860-1fa400-162b77094541286 | 2018-04-11 19:56:18.000000 UTC | 2018-04-11 20:02:54.000000 UTC | |
| 162899a5ec5895-0fc657f6c6ebde-33697b07-384000-162899a5ec68c6 | 2018-04-09 19:20:01.000000 UTC | 2018-04-11 19:38:59.000000 UTC | |
| 162b73858df1f8-0625fc7a476d418-76313118-3d10d-162b73858e2237 | 2018-04-11 17:19:53.000000 UTC | 2018-04-11 17:23:22.000000 UTC | |
| 162b6d32dd11a5-0bbf34346ce939-3553629-231015-162b6d32dd2646 | 2018-04-11 15:30:09.000000 UTC | 2018-04-11 16:40:08.000000 UTC | |
| 162875b83f63e2-0870a441baadb6-33697b07-384000-162875b83f714f | 2018-04-02 10:15:44.000000 UTC | 2018-04-11 14:56:37.000000 UTC | 2018-04-11 14:57:27.000000 UTC |
+————————————————————–+——————————–+——————————–+——————————–+

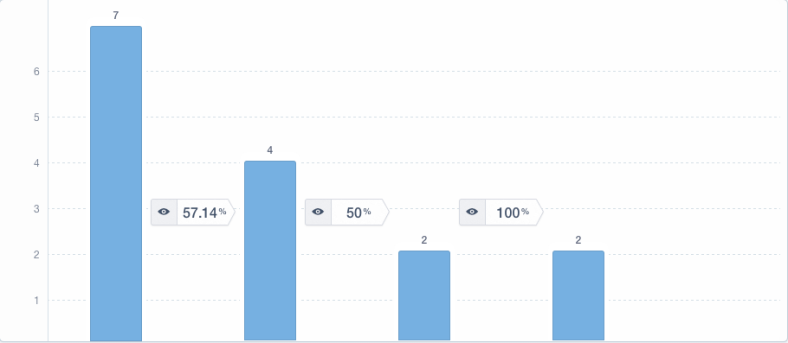
Measuring the Funnel

Finally, we count how many visitors made it to each step to get our funnel:


SELECT
COUNT(viewed_pricing_at) AS viewed_pricing,
COUNT(viewed_sign_up_at) AS viewed_sign_up,
COUNT(signed_up_at) AS signed_up
FROM (
SELECT
pricing.distinct_id,
MIN(viewed_pricing_at) AS viewed_pricing_at,
MIN(viewed_sign_up_at) AS viewed_sign_up_at,
MIN(signed_up_at) AS signed_up_at
FROM (
SELECT
distinct_id,
time AS viewed_pricing_at
FROM mp.event
WHERE
name = "Viewed Page" AND
current_url LIKE "https://www.helpscout.net/pricing/%"
) pricing
LEFT JOIN (
SELECT
distinct_id,
time AS viewed_sign_up_at
FROM mp.event
WHERE
name = "Viewed Page" AND
current_url LIKE "https://secure.helpscout.net/members/register/%"
) sign_up_page ON sign_up_page.distinct_id = pricing.distinct_id AND sign_up_page.viewed_sign_up_at > viewed_pricing_at
LEFT JOIN (
SELECT
distinct_id,
time AS signed_up_at
FROM mp.event
WHERE
name = "Signed Up"
) signed_up ON signed_up.distinct_id = pricing.distinct_id AND signed_up.signed_up_at > viewed_sign_up_at
GROUP BY 1
) visitor_data
+—————-+—————-+———–+
| viewed_pricing | viewed_sign_up | signed_up |
+—————-+—————-+———–+
| 1234 | 567 | 89 |
+—————-+—————-+———–+

Voila!

From here, you can take it a step further and segment the results on a property in the first step of the funnel or add a funnel duration to limit how long visitors have to complete the funnel, etc.

If you have any questions about this, don’t hesitate to reach out.

Querying Mixpanel using JQL from the Terminal

jql-terminal.png

Mixpanel provides a way to query the data you send to it using something they call JavaScript Query Language (JQL).

To experiment with it, you can navigate to the JQL app for your project:

Screen Shot 2018-04-09 at 4.07.17 PM.png

Which takes you to the JQL editor:

Screen Shot 2018-04-09 at 4.07.50 PM.png

Alternatively, you query Mixpanel’s JQL endpoint directly from a local script:

First, you need to create a file with the JQL. I called mine testing.js:


function main() {
return Events({
from_date: '2018-04-09',
to_date: '2018-04-09',
event_selectors: [{event: 'Signed Up'}]
});
}

view raw

testing.js

hosted with ❤ by GitHub

Next, grab your project’s API Secret from its settings.

Finally, execute the JQL:

$ curl --silent https://mixpanel.com/api/2.0/jql -u YOUR_API_KEY: --data-urlencode script@testing.js | python -m json.tool

The last part that pipes to python simply formats the JSON response when it’s displayed in the terminal for easy viewing:


[
{
"dataset": "$mixpanel",
"distinct_id": "162a9bea91d1cb-01213631147e12-3f636c4c-1aeaa0-162a9bea91e8cf",
"labels": [],
"name": "Signed Up",
"properties": {
"$browser": "Safari",
"$browser_version": 11.1,
"$city": "Verrieres-le-Buisson",
"$current_url": "https://secure.helpscout.net/welcome/segmentation-questions/",
"$initial_referrer": "$direct",
"$initial_referring_domain": "$direct",
"$lib_version": "2.20.0",
"$os": "Mac OS X",
"$referrer": "https://secure.helpscout.net/members/verification-code/",
"$referring_domain": "secure.helpscout.net",
"$region": "Essonne",
"$screen_height": 1050,
"$screen_width": 1680,
"com_id": 1234,
"mp_country_code": "FR",
"mp_lib": "web"
},
"sampling_factor": 1,
"time": 1523241142000
}
]

This is a trivial example obviously, but there’s a lot more you can do with JQL. You can use JQL to perform any type of analysis that you can in Mixpanel itself, and more.


Tracking What Pages Your Visitors View Prior to Signing Up Using Mixpanel, Fivetran, BigQuery, and Looker

setup.png

One of the things we’ve been analyzing at Help Scout recently is what paths individual companies take before signing up for a trial. For example, looking at a company that signed up last month, did they start their journey with Help Scout on our homepage? Or did they find us via our blog? Or one of our marketing landing pages? And once we know that, what other pages did they visit before signing up? Did that company wind up becoming a customer? How much did we make from them?

This post is about how we’ve wrangled the data using Mixpanel, Fivetran, BigQuery, and Looker to help us answer these questions.

Big picture, we’re tracking page view and sign up events in Mixpanel, syncing that data to BigQuery using Fivetran, then tying it to our internal company data in Looker for easy analysis.

Step 1: Tracking Page Views and Sign Ups in Mixpanel

If you’ve used an event-based analytics service, this step will be pretty straightforward. We load the Mixpanel script on every page, then fire a Viewed Page event:


<script>
mixpanel.track("Viewed Page");
</script>

view raw

viewed-page.js

hosted with ❤ by GitHub

And then if the company signs up for a trial, we fire a Signed Up event with that company’s id as a property:


mixpanel.track("Signed Up", {
com_id: comId
});

view raw

signed-up.js

hosted with ❤ by GitHub

These are the only two Mixpanel events we track. If we wanted to track actions in-app, we could also fire custom events for those, but we don’t at Help Scout because we tie this Mixpanel data together with our internal data about what companies have done in-app, eliminating the need for additional Mixpanel events.

Here’s what the Viewed Page event looks like in Mixpanel’s Live View:

Screen Shot 2018-04-06 at 1.42.07 PM.png

Also as we’ll see later, Mixpanel automatically tracks a lot of details about the visitor: things like the browser, country, URL, referrer, OS, etc, all of which we can use use in our analyses.

Step 2: Syncing Mixpanel data to BigQuery with Fivetran

Fivetran is this amazing service that specializes in helping you centralize all of your data in a data warehouse. For example, we have Fivetran connectors set up for MySQL (which we use internally at Help Scout), Salesforce, HubSpot, Google Sheets, and now Mixpanel:

Screen Shot 2018-04-06 at 1.46.42 PM.png

Screen Shot 2018-04-06 at 1.51.58 PM.png

Taking Mixpanel as an example, we provide Fivetran out Mixpanel API credentials, then Fivetran queries Mixpanel’s API periodically, cleans up the results, and throws it all in BigQuery:

Screen Shot 2018-04-06 at 1.50.21 PM.png

This lets us analyze our Mixpanel data just like we would other SQL data:


SELECT COUNT(*) FROM mp.event WHERE city = "Tokyo" AND DATE(time) = "2018-04-03"

view raw

tokyo.sql

hosted with ❤ by GitHub

We can also access the custom event properties that we’re tracking for the Signed Up event using Standard SQL’s json_extract_scalar function:


SELECT
properties,
JSON_EXTRACT_SCALAR(properties, "$.com_id") AS com_id
FROM mp.event
WHERE name = "Signed Up"
LIMIT 1
+—————–+——–+
| properties | com_id |
+—————–+——–+
| {"com_id":1234} | 1234 |
+—————–+——–+

view raw

com-id.sql

hosted with ❤ by GitHub

Once we have the company id, it’s just a matter of querying for a specific company id to view their event history:


SELECT
time,
name,
current_url
FROM (
SELECT
distinct_id,
CAST(JSON_EXTRACT_SCALAR(properties, "$.com_id") AS INT64) AS com_id
FROM mp.event
WHERE name = "Signed Up"
) signed_up
JOIN mp.event ON event.distinct_id = signed_up.distinct_id
WHERE signed_up.com_id = 1234
ORDER BY time ASC
+——————————–+————-+————————————————————–+
| time | name | current_url |
+——————————–+————-+————————————————————–+
| 2018-04-05 15:38:38.000000 UTC | Viewed Page | https://www.helpscout.net/ |
| 2018-04-05 15:38:40.000000 UTC | Viewed Page | https://secure.helpscout.net/members/login/ |
| 2018-04-05 15:38:46.000000 UTC | Viewed Page | https://www.helpscout.net/pricing/ |
| 2018-04-05 15:38:52.000000 UTC | Viewed Page | https://secure.helpscout.net/members/register/19/ |
| 2018-04-05 15:39:43.000000 UTC | Signed Up | https://secure.helpscout.net/welcome/segmentation-questions/ |
+——————————–+————-+————————————————————–+

Step 3: Modeling the data in Looker

If you have access to a Business Intelligence tool like Looker, you can model this Mixpanel data and how to join it with your other data.

First, create a view to model the Mixpanel event data:


view: mp_events {
sql_table_name: mp.event ;;
dimension: event_id {
primary_key: yes
type: number
sql: ${TABLE}.event_id ;;
}
dimension: browser {
type: string
sql: ${TABLE}.browser ;;
}
dimension: browser_version {
type: number
sql: ${TABLE}.browser_version ;;
}
dimension: city {
type: string
sql: ${TABLE}.city ;;
}
dimension: full_url {
type: string
sql: ${TABLE}.current_url ;;
}
dimension: has_url_parameters {
type: yesno
hidden: yes
sql: STRPOS(${full_url}, "?") > 0 ;;
}
dimension: current_url_without_parameters {
hidden: yes
label: "Current URL without Parameters"
type: string
sql:
CASE
WHEN ${has_url_parameters} THEN SUBSTR(${full_url}, 0, STRPOS(${full_url}, "?") – 1)
ELSE ${full_url}
END ;;
}
dimension: has_url_hash {
type: yesno
hidden: yes
sql: STRPOS(${current_url_without_parameters}, "#") > 0 ;;
}
dimension: current_url {
type: string
sql:
CASE
WHEN ${has_url_hash} THEN SUBSTR(${current_url_without_parameters}, 0, STRPOS(${current_url_without_parameters}, "#") – 1)
ELSE ${current_url_without_parameters}
END ;;
}
dimension: current_url_path {
type: string
sql: SUBSTR(${current_url}, STRPOS(${current_url}, "helpscout.net") + LENGTH("helpscout.net")) ;;
}
dimension: device {
type: string
sql: ${TABLE}.device ;;
}
dimension: distinct_id {
type: string
sql: ${TABLE}.distinct_id ;;
}
dimension: initial_referrer {
type: string
sql: ${TABLE}.initial_referrer ;;
}
dimension: initial_referring_domain {
type: string
sql: ${TABLE}.initial_referring_domain ;;
}
dimension: lib_version {
type: string
sql: ${TABLE}.lib_version ;;
}
dimension: mp_country_code {
type: string
sql: ${TABLE}.mp_country_code ;;
}
dimension: mp_lib {
type: string
sql: ${TABLE}.mp_lib ;;
}
dimension: name {
type: string
sql: ${TABLE}.name ;;
}
dimension: os {
type: string
sql: ${TABLE}.os ;;
}
dimension: properties {
type: string
sql: ${TABLE}.properties ;;
}
dimension: referrer {
type: string
sql: ${TABLE}.referrer ;;
}
dimension: referring_domain {
type: string
sql: ${TABLE}.referring_domain ;;
}
dimension: region {
type: string
sql: ${TABLE}.region ;;
}
dimension: screen_height {
type: number
sql: ${TABLE}.screen_height ;;
}
dimension: screen_width {
type: number
sql: ${TABLE}.screen_width ;;
}
dimension: search_engine {
type: string
sql: ${TABLE}.search_engine ;;
}
dimension_group: time {
label: "Event"
type: time
timeframes: [
raw,
time,
date,
week,
month,
quarter,
year
]
sql: ${TABLE}.time ;;
}
dimension: utm_source {
label: "UTM Source"
type: string
sql: JSON_EXTRACT_SCALAR(${properties}, "$.utm_source") ;;
}
dimension: utm_campaign {
label: "UTM Campaign"
type: string
sql: JSON_EXTRACT_SCALAR(${properties}, "$.utm_campaign") ;;
}
dimension: utm_term {
label: "UTM Term"
type: string
sql: JSON_EXTRACT_SCALAR(${properties}, "$.utm_term") ;;
}
dimension: utm_medium {
label: "UTM Medium"
type: string
sql: JSON_EXTRACT_SCALAR(${properties}, "$.utm_medium") ;;
}
dimension: utm_content {
label: "UTM Content"
type: string
sql: JSON_EXTRACT_SCALAR(${properties}, "$.utm_content") ;;
}
measure: count {
label: "Total Events"
type: count
drill_fields: [event_id, name]
}
measure: unique_visitors {
type: count_distinct
sql: ${distinct_id} ;;
}
}

Then create a view with a derived table to model the relationship between a distinct_id in Mixpanel with a company id:


view: mp_companies {
derived_table: {
sql:
SELECT
distinct_id,
CAST(JSON_EXTRACT_SCALAR(properties, "$.com_id") AS INT64) AS com_id
FROM mp.event
WHERE name = "Signed Up" ;;
}
dimension: distinct_id {
type: number
sql: ${TABLE}.distinct_id ;;
hidden: yes
}
dimension: com_id {
label: "Company ID"
type: number
sql: ${TABLE}.com_id ;;
}
}

Finally, connect those two views and any others you want to be able to analyze together:


connection: "bigquery"
include: "*.view.lkml"
explore: mp_events {
view_label: "Mixpanel"
label: "Mixpanel"
sql_always_where: STRPOS(${full_url}, "https://www.helpscout.net&quot;) = 1 OR STRPOS(${full_url}, "https://secure.helpscout.net&quot;) = 1 ;;
join: mp_companies {
view_label: "Mixpanel"
type: left_outer
relationship: many_to_one
sql_on: ${mp_companies.distinct_id} = ${mp_events.distinct_id} ;;
}
join: helpscout_companies {
view_label: "Company"
relationship: one_to_one
sql_on: ${helpscout_companies.com_id} = ${mp_companies.com_id} ;;
}
}

view raw

mp.lookml

hosted with ❤ by GitHub

Step 4: Analyzing the data in Looker

Once you’ve modeled the data, you can analyze the event history for specific companies, track trends like page views and unique visitors, and more:

Screen Shot 2018-04-06 at 2.28.57 PM.png

In future posts I’ll walk through some of the other interesting analyses you can perform with this data.

If you have any questions about this setup, don’t hesitate to reach out.

Prioritization for Data Analysts


next-looker.png

For the past two years I’ve worked as a data scientist, first on the marketing team for WordPress.com and now on the growth team at Help Scout. In both of these roles I’ve been the sole data analyst on my team so I tend to have more work to do than I have time for. As a result, I spend a lot of time thinking about how to prioritize what’s on my plate. My goal with this post is to share some of what I’ve learned to help other data folks who are in similar roles.

The prioritization problem

Here’s a made up scenario:

Your manager asks you for help with a medium priority analysis that will take several days. Shortly after you begin working on it, a coworker pings you for help with an urgent request that will only take a few hours. A little while later, your boss’s boss asks you for help with a low priority one-day project.

You now have three requests from people with differing seniority each with a different duration and urgency – which do you work on next and why?

Ad hoc requests vs projects

At a high level, there are two types of data requests:

Ad hoc requests are questions that can be answered fairly quickly. They may take a few minutes or a few hours and the urgency can range from “drop what you’re doing” to “no rush at all”.

Projects take longer and usually have a higher impact on the business. For me, they range from a few days to (rarely) a few weeks.

While it may be tempting to only want to work on ad hoc requests or only on projects, the reality is that they’re both important and if you’re the only analyst, you’ll need to work them both into your schedule. For example, even if you’re working on a big project, you can’t simply ignore the urgent ad hoc requests that come up during the course of a week. Telling your CEO that you’ll get to his request in three weeks when you’re done with your project is not recommended.

Therefore my advice is to set aside about two hours each day to work on ad hoc data requests and spend the rest of your time working on your highest priority project. This will give you time to work on those longer, high impact initiatives but still give you time to work on the shorter requests as well.

I wouldn’t loop your manager into the prioritization of ad hoc data requests; he or she probably has better things to do than helping you decide “spend 30 minutes on this then spend an hour on that” etc etc. Use your judgment: work on whatever is the most urgent or will have the highest impact on the business. When in doubt, base it on the seniority of whoever is asking.

For projects, I definitely would recommend getting your manager’s help prioritizing what to work on. He or she help you decide where you can be the most impactful and when questions come up about why you’re not working on some other thing, it’s not just you who made that call.

I would only work on one project at a time. I’ve tried doing like 3 hours a day on one project, 3 hours a day on another, but all that’s going to do is make both take twice as long if not longer due to the frequent context switching.

When you meet with your manager, keep him or her up to date about where you’re at with your project. Often it’s hard to predict at the start how long a project will take. Something you thought might take a week will take a day. Something you thought would take three days will take two weeks. That’s just the nature of it. Keeping your lead informed.

Sometimes priorities will change. Your expected three-day project that is now in its second week may get put on the back burner in order to work on something else. It’s easy to get frustrated when this happens, but remember that you’re there to have the biggest impact on the business, not to finish projects just for the sake of finishing them. Sometimes what’s highest priority will change so be flexible.

When priorities change and you have to change projects midway, try to estimate what impact that will have on the completion of the original project. If you estimated you would complete your original project by the end of the week, but by switching projects it will now take an additional week, communicate that to the people waiting on the result of the original analysis.

Get clarity before beginning your analysis

Regardless of whether a request is ad hoc or a project, I’d recommending asking the requestor several questions:

  • How important is this?
  • Is there a deadline?
  • How accurate do you need the answer to be?
  • What type of end result are you looking for?

If you don’t ask about importance, you risk spending a lot of time on an analysis that is not that important to the person asking about it. It’s common for someone to ask a quick hey-I-wonder-about-this question, but they only care if you can find the answer quickly.

Similarly, ask whether it needs to be done by a specific date. If the answer is holding something up, it should get higher priority than something that doesn’t.

Asking about accuracy is something that took me a while to appreciate too. I’ve run into a lot of data requests that I can give a 95% accurate solution to fairly quickly, but that would take much longer to get to 100%. A lot of times, people will be fine with a 95% quick solution. Understanding when 95% is acceptable and when 100% is necessary can save you a lot of time.

Sometimes I also ask what type of end result the person is interested in. It often helps them and you clarify what the analysis is all about.

For longer projects, I’d also recommend periodically updating the person who requested it with your progress. As they see your progress, they might want to refine the request or may be happy with the results as-is, freeing you up to work on something else.

Staying organized

I’ve seen some data teams ask people to fill out a little template (usually in a Trello card) to help people ask good data questions. I prefer to discuss the details with the person, then create a Trello card for myself with the relevant information.

I would recommend keeping a list of all potential projects and ad hoc data requests. That is, don’t just try to keep it all in your head. I do this in Trello with four lists:

  • Multi-week Projects
  • Multi-day Projects
  • Multi-hour Projects
  • Quick Requests

Whenever someone asks a question, I get the details from them then create a new card and add it to the appropriate list.

You could also have a Completed list where you drag cards as you complete them to keep a record of it. I’ve also seen some teams have a list for each month or quarter (January 2018, February 2018, etc) and drag completed cards to the relevant list when it’s complete. I did that in the past, but tend to just archive the cards now to avoid cluttering up the Trello board.

Invest in a proper BI tool like Looker

One other big win has been switching from manual data analysis (using MySQL queries and R) to Looker, the premier Business Intelligence (BI) tool on the market today. I could go on for hours about how amazing Looker is, but at a high level it lets you:

  • Create dashboards that are automatically updated as the underlying data changes.
  • Use LookML, Looker’s modeling language, to teach Looker how our data fits together. With that in place, I rarely have to write queries by hand anymore. I can use Looker’s interface to quickly ask and answer questions.
  • This also means that other people at the company who may not have querying skills can answer their own questions without asking me every time.

I’d highly recommend checking out Looker if you still find yourself wrangling data a slow manual way.

If this post resonates with you, I’d love to connect

If you’re a data analyst, especially if you’re the only one at your company or part of a small team, I’d love to chat to learn more about what you’re working on, how you prioritize, etc. Drop me a note: matthew.h.mazur@gmail.com. Cheers!