
If you work on a SaaS product, you probably have a good idea of what its cancellation rates are, but chances are you don’t know how that changes over time. For example, what % of users cancel after 1 day? How about after 7 days, 30 days, etc?
I worked on a project at Automattic this week to help us understand the cancellation curves for WordPress.com’s plans and am open sourcing the R script so anyone can do the same for their service.
Here’s an example of how the cancellation curves might look for a service with a Gold, Silver, and Bronze plan:
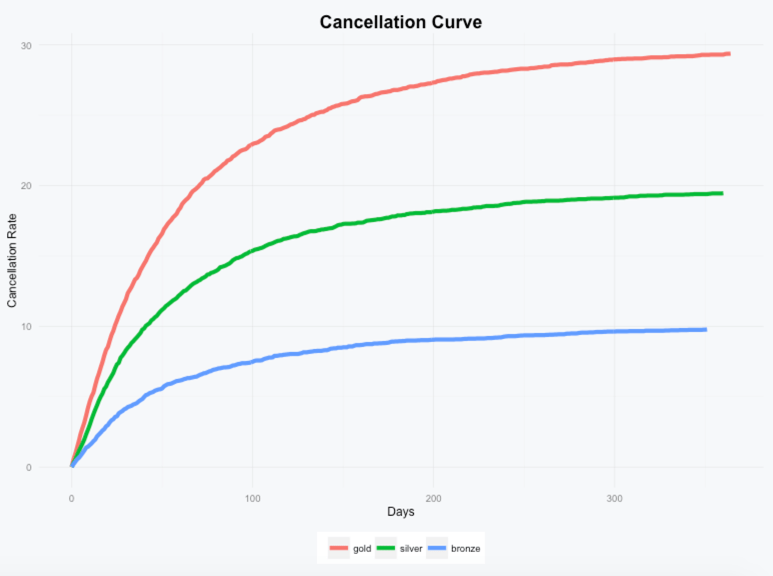
We can see that most users who cancel do so pretty quickly and that long term about 30% of Gold plan, 20% of Silver plan, and 10% of Bronze plan subscriptions wind up cancelled.
To generate this data for your own product, you’ll just need three data points for each subscription: when it was purchased, when it was cancelled (if it was), and the name of the subscription. The script will take care of analyzing the data and generating the visualization.
You can check out the script and additional details on GitHub here: Cancellation Curve Visualizer.
If you have any questions or run into any issues, don’t hesitate to drop me a note.
