Looking back at my time so far as a data analyst, some of the biggest mistakes I’ve made were not technical in nature but around how I communicated within the organization.
Two real-world examples to illustrate:
A few years ago at Automattic our ad revenue was way down from what our marketing team expected it to be. For example (and I’m making up numbers here), for every $100 we were spending on ads, we had been making $150 historically, but in recent months we were making $25. Either the performance had gone way down or there was some issue with the tracking and reporting.
I was on the data team at the time and volunteered to work with the marketing team to investigate. As it turned out, there was indeed an issue: there was a problem with the way AdWords was appending UTM parameters to our URLs which was breaking our tracking. For example, a visitor would click an ad and land on wordpress.com/business&utm_source=adwords – note that there’s an amperstand after the URL path instead of a question mark, so the correct UTM source wouldn’t get tracked and the customer wouldn’t get attributed to AdWords.
Fortunately, we had some event tracking set up on these pages (Tracks for the win) that recorded the full URL, so I was able to go back and determine which customers came from ads and calculate what our actual return on ad spend was. After figuring out the issue and determining how much unattributed revenue we had, I wrote up a lengthy post about what happened and published it on our internal marketing blog without informing the marketing team about it first.
Second example: a few months ago at Help Scout, we had an ambitious revenue target for Q1. With a few days left in the quarter, we were still projecting to come in short of the target and no one realistically expected us to reach it. Something about the projection seemed off to me so I dove in and realized there was a mistake in one of the calculations (it was my fault – in the projection we weren’t counting revenue that we earned that month from customers that were delinquent who then became paying again). As a result, our projection was too low and we likely were going to hit our target (and eventually did!). I wrote up a lengthy message about what happened and published it in one of our company Slack channels without informing any of the leadership about it first.
To understand the problem, it’s important to note that as a data analyst, I haven’t typically been responsible for the performance of our metrics. I help set up tracking and reporting and help ensure accuracy, but someone else in the organization is responsible for how well those metrics were doing.
In both of the cases above, I wasn’t intentionally bypassing people. At the time, it was more like “oh, hey, there’s a bug, now it’s fixed, better let everyone know about it” – and probably an element of wanting credit for figuring out the issue too.
However, not consulting with those responsible for the metrics before reporting it was a mistake for several reasons:
They didn’t have an opportunity to help me improve how the issue and impact were communicated with the rest of the company and its leadership.
I missed an opportunity to have them doublecheck the revised calculations, which could have been wrong.
Even though we were doing better than we had been reporting in both cases, it may have indirectly made people look bad because they had been reporting performance based on inaccurate data. They should not be finding out about the issue at the same time as the rest of the company.
In neither case was there any big drama about how I went about it, but it was a mistake on my part nonetheless.
Here’s what I’d recommend for anyone in a similar role: if someone else in your organization is responsible for the performance of a metric and you as a data analyst discover some issue with the accuracy of that metric, always discuss it with them first and collaborate with them on how it is communicated to the rest of the company.
It sounds obvious in retrospect, but it’s bitten me a few times so I wanted to share it with the hope that it helps other analysts out there avoid similar issues. Soft skills like this are incredibly important and worth developing in parallel with your technical skills.
If you’ve made any similar mistakes or have any related lessons learned, I’d love to hear about them in the comments or by email. Cheers!
If you work at a company that publishes a lot of content, it’s important to understand how well that content is performing. Not just in terms of page views and unique visitors, but whether it converts visitors into trials, etc.
At Help Scout we have a Looker dashboard to help us track all of these things and more. In this post, I’ll walk you through how we track the daily unique visitors to our recently published blog posts. For example, on May 2nd we published April’s Release Notes – how many people viewed that post on the day it was published? How about the day after? And how does that compare to our other recently published content?
With this data in hand, we need to figure out a way to determine what the recent blog posts were so that we can limit our analysis to them.
Here’s the query we use:
This file contains hidden or bidirectional Unicode text that may be interpreted or compiled differently than what appears below. To review, open the file in an editor that reveals hidden Unicode characters. Learn more about bidirectional Unicode characters
For Help Scout blog URLs (ie, URLs that begin with https://www.helpscout.net/blog/), we need to determine when the post was published. That’s the same as the first day it was viewed. However, because we launched Mixpanel page view tracking on April 3rd, this would make it look like every one of our posts was published on April 3rd or sometime after that. That’s why we limit the results to April 4th or later. Also, we want to limit it to posts that received at least a certain number of visitors that first day, otherwise the results will wind up including low traffic posts that were first viewed after April 4th.
This query gets us a list of those recently published posts:
This file contains hidden or bidirectional Unicode text that may be interpreted or compiled differently than what appears below. To review, open the file in an editor that reveals hidden Unicode characters. Learn more about bidirectional Unicode characters
Over in Looker, we’re going to create a derived table with these results so that we can determine whether a given Mixpanel event URL is a recently published blog post:
This file contains hidden or bidirectional Unicode text that may be interpreted or compiled differently than what appears below. To review, open the file in an editor that reveals hidden Unicode characters. Learn more about bidirectional Unicode characters
The reason we have the is_new_blog_content dimension here is because we’re going to LEFT JOIN all Mixpanel events on this derived table by the URL. Not all URLs will have a match in this table, so this dimension will let us limit the analysis to just events that were a recently published blog post.
Here’s how we model the relationship between our main Mixpanel events model and this derived table:
This file contains hidden or bidirectional Unicode text that may be interpreted or compiled differently than what appears below. To review, open the file in an editor that reveals hidden Unicode characters. Learn more about bidirectional Unicode characters
One other key piece of this is that we model how to calculate unique visitors in the main Mixpanel events view:
This file contains hidden or bidirectional Unicode text that may be interpreted or compiled differently than what appears below. To review, open the file in an editor that reveals hidden Unicode characters. Learn more about bidirectional Unicode characters
With these foundations in place, we can then create the chart we set out to.
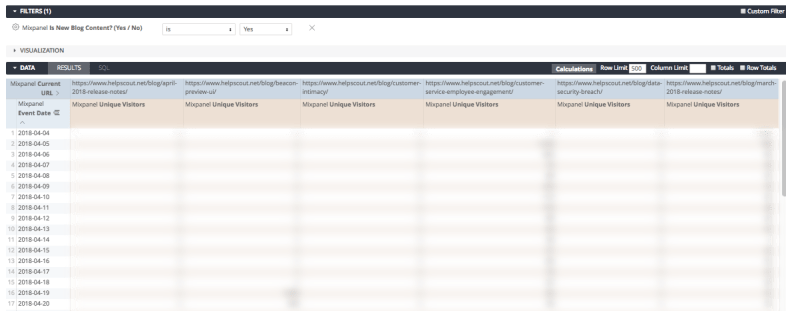
We want to use that Is New Blog Content dimension to limit the results to recently published posts, then pivot the daily unique visitor count on the URL:
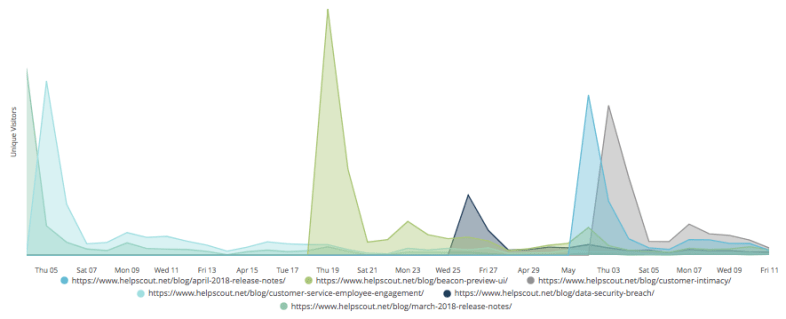
Then it’s just a matter of setting up the chart in Looker and voila, there we have it:
Going forward, without anyone having to log into Google Analyics, we’ll be able to track the popularity of our new blog posts and track the trends over time.
By the way, that spike on April 19th is from our CEO’s Beacon 2.0 Preview: The User Interface post, all about Help Scout’s soon-to-be-released live chat & improved self service tool. If you’re interested in getting notified when it launches, you can sign up here.
In a recent post I outlined how to use Fivetran to sync Mixpanel data to BigQuery for analysis in Looker. Today we’ll walk through how to write a SQL query to analyze a funnel using the Mixpanel data in BigQuery.
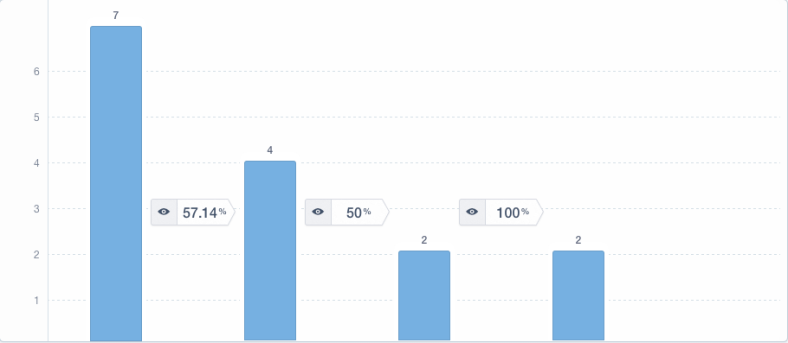
For this analysis, we’re going to create a three-step funnel showing how many visitors who start on Help Scout’s pricing page click through to the sign up page and then sign up.
One Step
To begin, lets just look at visitors who viewed the pricing page:
This file contains hidden or bidirectional Unicode text that may be interpreted or compiled differently than what appears below. To review, open the file in an editor that reveals hidden Unicode characters. Learn more about bidirectional Unicode characters
Next, we’ll join these results on sign up page data, making sure that the sign up page views occurred after the pricing page views:
This file contains hidden or bidirectional Unicode text that may be interpreted or compiled differently than what appears below. To review, open the file in an editor that reveals hidden Unicode characters. Learn more about bidirectional Unicode characters
The reason we LEFT JOIN is because not all visitors will make it to the next step of the funnel and we want the data to reflect that.
Note that we join on both the distinct_id (to ensure each result is for a single visitor) and on the time the events occurred.
Three Steps
Extending this to the third and final step of the funnel, the Signed Up event, we get:
This file contains hidden or bidirectional Unicode text that may be interpreted or compiled differently than what appears below. To review, open the file in an editor that reveals hidden Unicode characters. Learn more about bidirectional Unicode characters
| 1628be3f8ab208-0678714f9f0ec-b34356b-1fa400-1628be3f8b825 | 2018-04-03 07:31:26.000000 UTC | 2018-04-09 06:08:08.000000 UTC | |
| 1628be3f8ab208-0678714f9f0ec-b34356b-1fa400-1628be3f8b825 | 2018-04-05 12:48:37.000000 UTC | 2018-04-09 06:08:08.000000 UTC | |
| 1628be3f8ab208-0678714f9f0ec-b34356b-1fa400-1628be3f8b825 | 2018-04-03 07:28:42.000000 UTC | 2018-04-09 06:08:08.000000 UTC | |
| 1628be3f8ab208-0678714f9f0ec-b34356b-1fa400-1628be3f8b825 | 2018-04-03 07:27:49.000000 UTC | 2018-04-09 06:08:08.000000 UTC | |
| 1628be3f8ab208-0678714f9f0ec-b34356b-1fa400-1628be3f8b825 | 2018-04-03 07:35:51.000000 UTC | 2018-04-09 06:08:08.000000 UTC | |
| 162914788c5fb-09337b4c437dc4-b34356b-144000-162914788c628 | 2018-04-04 17:30:18.000000 UTC | 2018-04-04 17:31:13.000000 UTC | 2018-04-04 17:34:51.000000 UTC |
| 162914788c5fb-09337b4c437dc4-b34356b-144000-162914788c628 | 2018-04-04 08:31:16.000000 UTC | 2018-04-04 17:24:52.000000 UTC | 2018-04-04 17:34:51.000000 UTC |
Determining the First Event Occurrence for Each Step
The query above will return every combination of pricing page views, sign up page views, and sign up events for each visitor. For our funnel though, we don’t care whether they loaded the pricing page or sign up page multiple times, we only care that they did it at all. So we modify the query to only return the first instance of each event for each visitor:
This file contains hidden or bidirectional Unicode text that may be interpreted or compiled differently than what appears below. To review, open the file in an editor that reveals hidden Unicode characters. Learn more about bidirectional Unicode characters
| 162931933729b2-0b3ba365e6d865-336c7b05-384000-1629319337333b | 2018-04-04 16:58:45.000000 UTC | 2018-04-11 20:50:13.000000 UTC | 2018-04-11 20:51:46.000000 UTC |
| 162b770945247a-0145ce1cbf076d8-495860-1fa400-162b77094541286 | 2018-04-11 19:56:18.000000 UTC | 2018-04-11 20:02:54.000000 UTC | |
| 162899a5ec5895-0fc657f6c6ebde-33697b07-384000-162899a5ec68c6 | 2018-04-09 19:20:01.000000 UTC | 2018-04-11 19:38:59.000000 UTC | |
| 162b73858df1f8-0625fc7a476d418-76313118-3d10d-162b73858e2237 | 2018-04-11 17:19:53.000000 UTC | 2018-04-11 17:23:22.000000 UTC | |
| 162b6d32dd11a5-0bbf34346ce939-3553629-231015-162b6d32dd2646 | 2018-04-11 15:30:09.000000 UTC | 2018-04-11 16:40:08.000000 UTC | |
| 162875b83f63e2-0870a441baadb6-33697b07-384000-162875b83f714f | 2018-04-02 10:15:44.000000 UTC | 2018-04-11 14:56:37.000000 UTC | 2018-04-11 14:57:27.000000 UTC |
Finally, we count how many visitors made it to each step to get our funnel:
This file contains hidden or bidirectional Unicode text that may be interpreted or compiled differently than what appears below. To review, open the file in an editor that reveals hidden Unicode characters. Learn more about bidirectional Unicode characters
From here, you can take it a step further and segment the results on a property in the first step of the funnel or add a funnel duration to limit how long visitors have to complete the funnel, etc.
If you have any questions about this, don’t hesitate to reach out.
One of the things we’ve been analyzing at Help Scout recently is what paths individual companies take before signing up for a trial. For example, looking at a company that signed up last month, did they start their journey with Help Scout on our homepage? Or did they find us via our blog? Or one of our marketing landing pages? And once we know that, what other pages did they visit before signing up? Did that company wind up becoming a customer? How much did we make from them?
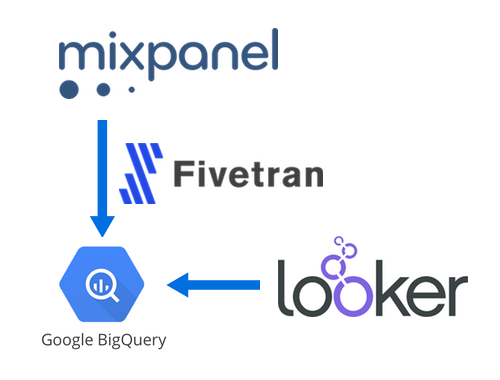
This post is about how we’ve wrangled the data using Mixpanel, Fivetran, BigQuery, and Looker to help us answer these questions.
Big picture, we’re tracking page view and sign up events in Mixpanel, syncing that data to BigQuery using Fivetran, then tying it to our internal company data in Looker for easy analysis.
Step 1: Tracking Page Views and Sign Ups in Mixpanel
If you’ve used an event-based analytics service, this step will be pretty straightforward. We load the Mixpanel script on every page, then fire a Viewed Page event:
This file contains hidden or bidirectional Unicode text that may be interpreted or compiled differently than what appears below. To review, open the file in an editor that reveals hidden Unicode characters. Learn more about bidirectional Unicode characters
And then if the company signs up for a trial, we fire a Signed Up event with that company’s id as a property:
This file contains hidden or bidirectional Unicode text that may be interpreted or compiled differently than what appears below. To review, open the file in an editor that reveals hidden Unicode characters. Learn more about bidirectional Unicode characters
These are the only two Mixpanel events we track. If we wanted to track actions in-app, we could also fire custom events for those, but we don’t at Help Scout because we tie this Mixpanel data together with our internal data about what companies have done in-app, eliminating the need for additional Mixpanel events.
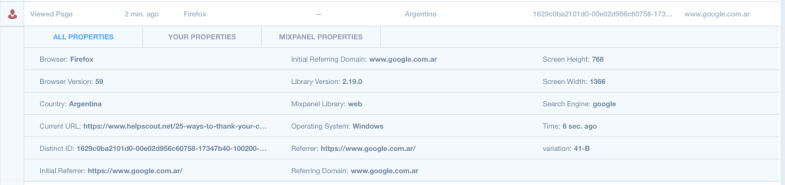
Here’s what the Viewed Page event looks like in Mixpanel’s Live View:
Also as we’ll see later, Mixpanel automatically tracks a lot of details about the visitor: things like the browser, country, URL, referrer, OS, etc, all of which we can use use in our analyses.
Step 2: Syncing Mixpanel data to BigQuery with Fivetran
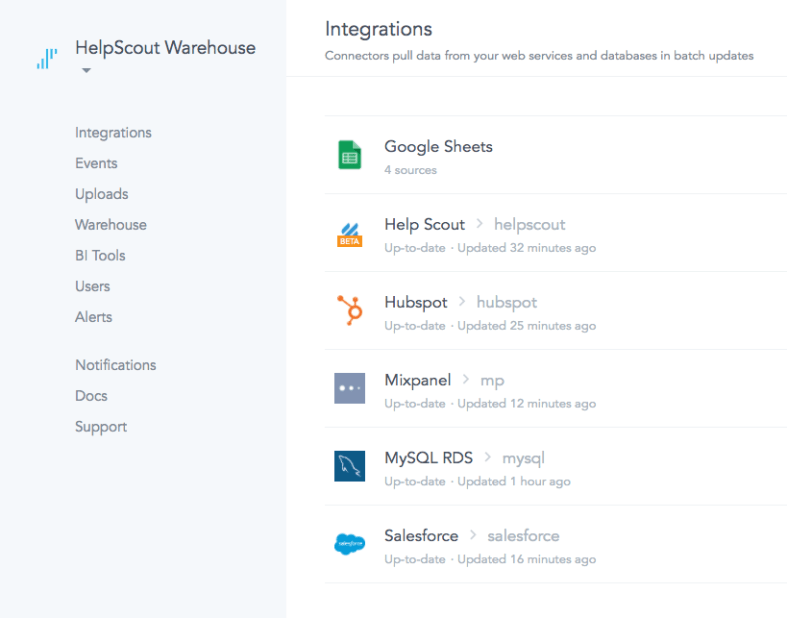
Fivetran is this amazing service that specializes in helping you centralize all of your data in a data warehouse. For example, we have Fivetran connectors set up for MySQL (which we use internally at Help Scout), Salesforce, HubSpot, Google Sheets, and now Mixpanel:
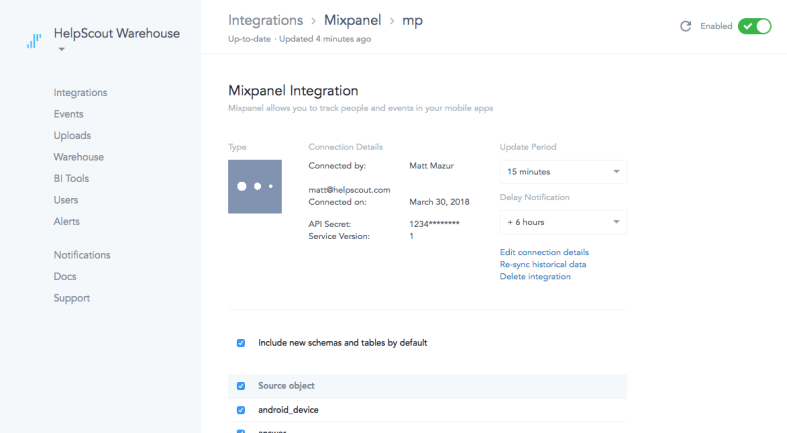
Taking Mixpanel as an example, we provide Fivetran out Mixpanel API credentials, then Fivetran queries Mixpanel’s API periodically, cleans up the results, and throws it all in BigQuery:
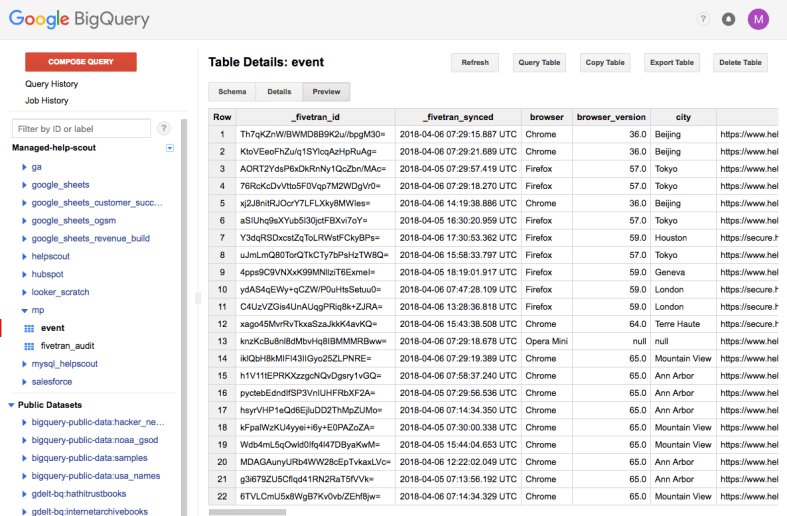
This lets us analyze our Mixpanel data just like we would other SQL data:
This file contains hidden or bidirectional Unicode text that may be interpreted or compiled differently than what appears below. To review, open the file in an editor that reveals hidden Unicode characters. Learn more about bidirectional Unicode characters
This file contains hidden or bidirectional Unicode text that may be interpreted or compiled differently than what appears below. To review, open the file in an editor that reveals hidden Unicode characters. Learn more about bidirectional Unicode characters
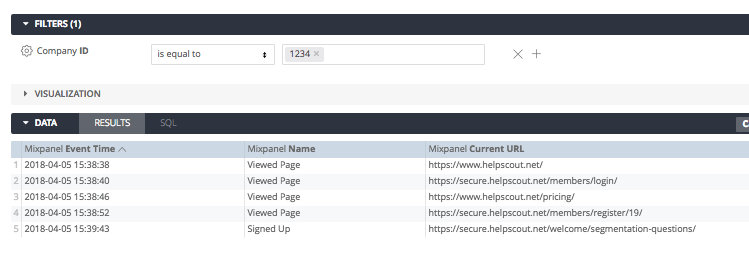
Once we have the company id, it’s just a matter of querying for a specific company id to view their event history:
This file contains hidden or bidirectional Unicode text that may be interpreted or compiled differently than what appears below. To review, open the file in an editor that reveals hidden Unicode characters. Learn more about bidirectional Unicode characters
If you have access to a Business Intelligence tool like Looker, you can model this Mixpanel data and how to join it with your other data.
First, create a view to model the Mixpanel event data:
This file contains hidden or bidirectional Unicode text that may be interpreted or compiled differently than what appears below. To review, open the file in an editor that reveals hidden Unicode characters. Learn more about bidirectional Unicode characters
Then create a view with a derived table to model the relationship between a distinct_id in Mixpanel with a company id:
This file contains hidden or bidirectional Unicode text that may be interpreted or compiled differently than what appears below. To review, open the file in an editor that reveals hidden Unicode characters. Learn more about bidirectional Unicode characters
Finally, connect those two views and any others you want to be able to analyze together:
This file contains hidden or bidirectional Unicode text that may be interpreted or compiled differently than what appears below. To review, open the file in an editor that reveals hidden Unicode characters. Learn more about bidirectional Unicode characters