Learning to Read

book.jpg

Over the last few years I’ve read maybe 2-3 books per year and a good chunk of those were audiobooks so I’m not sure they even qualify as reading. Part of that is that reading hasn’t been a priority for me: given a choice between working on side projects, spending time with my family, watching Game of Thrones and other shows, or reading, I normally don’t choose to read. Another part of it is that I’ve found it harder and harder to sit and read for more than a few minutes; years of Facebook and Twitter have taken their toll on my attention span.

That all changed recently when I made a few modifications to my reading habits. Many of these changes were inspired by discussions on Seeking Wisdom, a fantastic new podcast by David Cancel and Dave Gerhardt about a wide variety of topics including building great products, marketing, personal growth, work-life balance, and more.

Here are the key changes I made:

  • Reading physical books, not ebooks. Many people love the convenience of ebooks, but I’ve always preferred physical books. Rather than try to force myself to read on a Kindle or a tablet, I’ve switched back to reading physical books. There’s just something about the texture and smell of physical books that I really enjoy. Also, by not reading on the Kindle app on my iPad I can avoid notifications and other distractions like checking my email, Facebook, etc.
  • Reading multiple books at once. In the past, I’ve always focused on reading one book at a time but by having multiple books to choose from I can select one depending on the mood I’m in which makes it more likely that I’ll actually do it. If I’m not in the mood to read a business book, for example, I have plenty of others to choose from. I no longer have to tell myself “I’ll read that book after I finish this one.” It does take longer to finish a book, but that’s fine; the goal of reading isn’t to finish books.
  • Allowing myself to stop reading books that don’t interest me. In the past I would try to force myself to get through any book I started. Problem is that I’d inevitably wind up starting a book that didn’t grab me, then I’d just quit reading all together because I hadn’t finished that book.
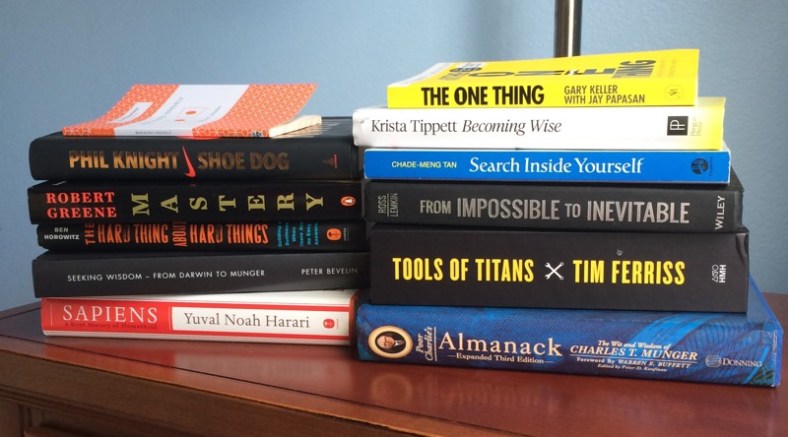
  • Skipping parts that don’t hold my attention. Years ago I started reading Poor Charlie’s Almanac, a treasure trove of wisdom from Berkshire Hathaway’s Charlie Munger. The first chapter is about Charlie’s life and for whatever reason I struggled to get through it so stopped reading the book completely. This time around, I skipped that chapter and dove straight into the later chapters which I’ve found a lot more engaging.
  • Making it a habit. Every night before I go to sleep, I try to read for 20 to 30 minutes. I do wind up watching less Netflix/HBO to make time for it, but that’s a tradeoff that I’m happy to make. As an added benefit, I’ve been finding it much easier to fall asleep after reading vs working on a side project or watching TV.

A lot of these seem obvious in retrospect, but it took a while for their importance to really click for me. I’d encourage anyone who wants to get back into reading to experiment and see what works for you.

If you have any other suggestions on how to read more effectively, don’t hesitate to drop me an email or leave a comment below.

My R Cheat Sheet, now available on GitHub

Despite working on and off with R for about two years now, I can never seem to remember how to do basic things when I return to it after a few weeks away.

I recently started keeping detailed notes for myself to minimize how much time I spend figuring things out that I already learned about in the past.

You can check out my cheat sheet on GitHub here:

https://github.com/mattm/r-cheat-sheet

It covers everything from data frames to working with dates and times to using ggplot and a lot more. I’ll update it periodically as I add new notes.

If you spot any mistakes or have any suggestions for how to improve it, don’t hesitate to shoot me an email.

Automattic is hiring a Marketing Data Analyst

We’re now accepting applications for a new Marketing Data Analyst position at Automattic that might interest some of you:

https://automattic.com/work-with-us/marketing-data-analyst/

In this role you’d be helping us use data and analytics to guide the direction of our marketing efforts on WordPress.com.

Here’s the official description:

Automattic is looking for a data analyst to join the marketing team. You will distill data into actionable insights to guide our customer marketing and retention strategy as well as inform product development efforts.

Primary responsibilities include:

  • Build and maintain standardized reporting on key metrics across the customer lifecycle.
  • Develop customer segmentation models to inform tailored, multi-channel marketing strategies.
  • Conduct ad hoc analyses to better understand customer behavior, needs, and individual test results.
  • Partner with other analysts and developers to increase data accessibility across the organization.
  • Design a process for prioritizing and communicating data requests and priorities.

You:

  • Are proficient in SQL and Excel.
  • Have experience with web analytics platforms such as: Google Analytics, KISSmetrics, or Mixpanel.
  • Have experience working with marketing teams to deliver analyses and answer business questions.
  • Are able to communicate data in a way that is easy to understand and presents clear recommendations.
  • Are highly collaborative and experienced in working with business owners, executives, developers and creatives to discuss data, strategy and tests.
  • Have excellent prioritization and communication skills.
  • Ideally, have web development experience (though not required).

Like all positions at Automattic, you’ll work remotely, and can be based wherever you live. It’s not a requirement that you live in or relocate to the Bay Area to do this job.

If this sounds interesting to you (and how could it not?!?) there are instructions at the bottom of the job description about how to apply.

And if you have any questions about Automattic or this data analyst position, feel free to drop me an email: mhmazur@automattic.com.


Visualizing Your SaaS Plan Cancellation Curves

If you work on a SaaS product, you probably have a good idea of what its cancellation rates are, but chances are you don’t know how that changes over time. For example, what % of users cancel after 1 day? How about after 7 days, 30 days, etc?

I worked on a project at Automattic this week to help us understand the cancellation curves for WordPress.com’s plans and am open sourcing the R script so anyone can do the same for their service.

Here’s an example of how the cancellation curves might look for a service with a Gold, Silver, and Bronze plan:

example.png

We can see that most users who cancel do so pretty quickly and that long term about 30% of Gold plan, 20% of Silver plan, and 10% of Bronze plan subscriptions wind up cancelled.

To generate this data for your own product, you’ll just need three data points for each subscription: when it was purchased, when it was cancelled (if it was), and the name of the subscription. The script will take care of analyzing the data and generating the visualization.

You can check out the script and additional details on GitHub here: Cancellation Curve Visualizer.

If you have any questions or run into any issues, don’t hesitate to drop me a note.